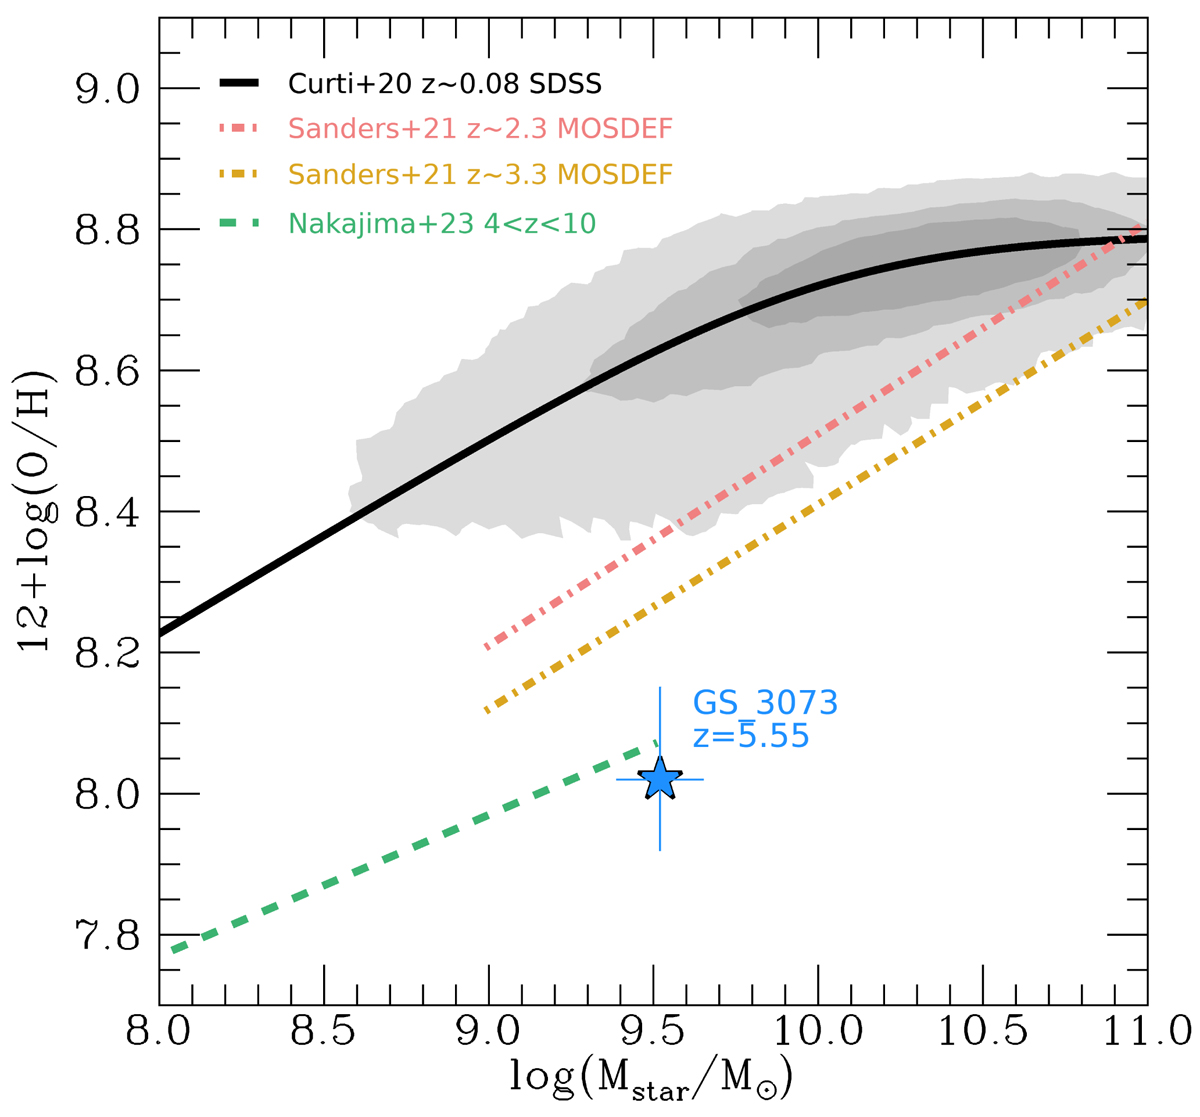
Fig. 5.
Download original image
GS_3073 in the mass-metallicity plane (blue star). The z ∼ 0.08 relation based on SDSS data by Curti et al. (2020a) is shown as grey shading with the best fit in black. The red and yellow dash-dotted lines show the best fit relations at z ∼ 2.3 and z ∼ 3.3, respectively, by Sanders et al. (2021) based on data from the MOSDEF survey (Kriek et al. 2015). The dashed green line shows the best fit relation obtained by Nakajima et al. (2023) based on a compilation of early JWST data at redshifts 4 < z < 10. At z = 5.55, GS_3073 is slightly more massive but still compatible with the extrapolation of this relation.
Current usage metrics show cumulative count of Article Views (full-text article views including HTML views, PDF and ePub downloads, according to the available data) and Abstracts Views on Vision4Press platform.
Data correspond to usage on the plateform after 2015. The current usage metrics is available 48-96 hours after online publication and is updated daily on week days.
Initial download of the metrics may take a while.