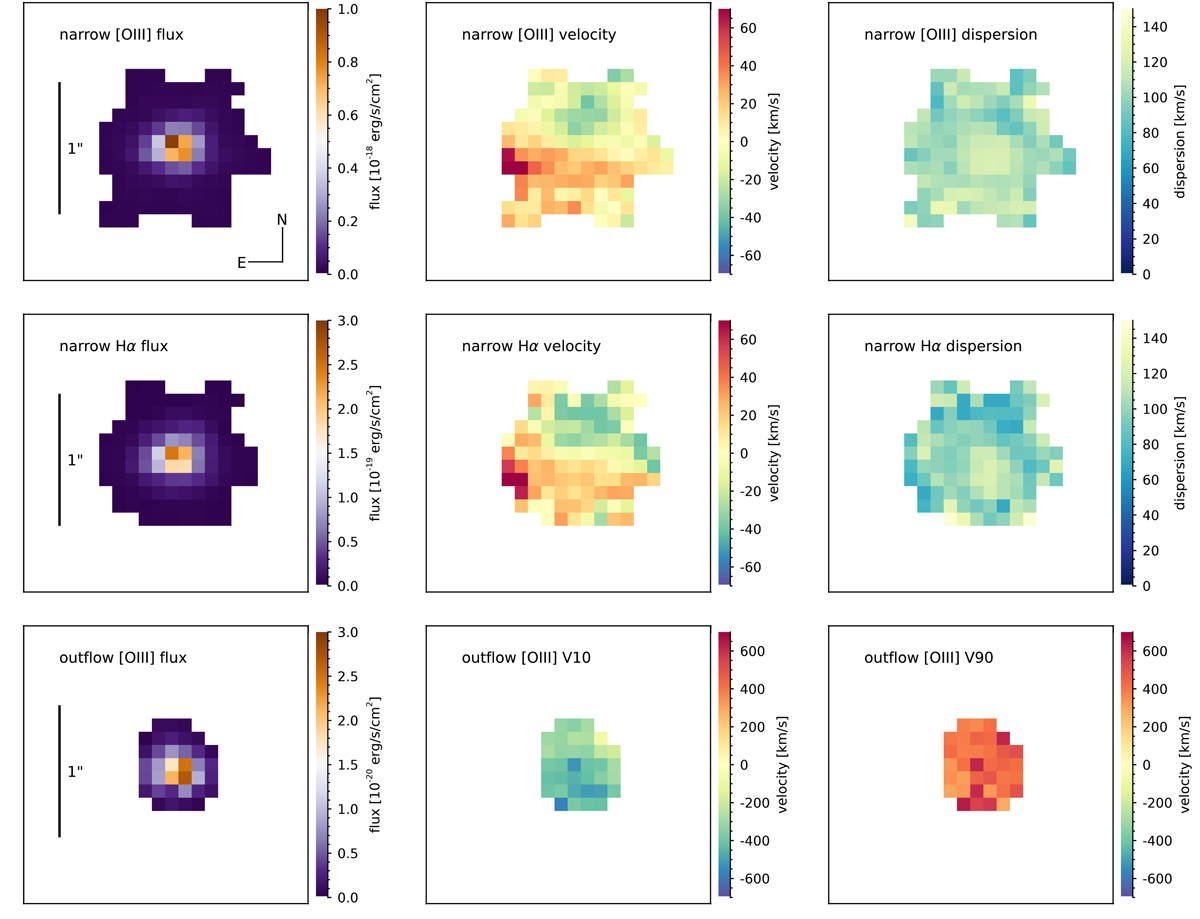
Fig. 3.
Download original image
Projected maps of line flux, velocity, and velocity dispersion. Top and middle row: flux (left), velocity (middle), and velocity dispersion corrected for instrumental resolution (right) as measured from the narrow [O III] component (top) and the narrow Hα component (middle) tracing the host galaxy kinematics. Bottom: flux (left), V10, the velocity at the 10th percentile of the emission-line profile (middle), and V90, the velocity at the 90th percentile (right), from the outflow [O III] component. North is up and East is to the left. The spaxel size is 0.1″. A bar in the first column indicates 1″, corresponding to roughly 6 kpc at the source redshift. The highest projected velocities are found in the East-South-East region in both the narrow Hα and [O III] velocity maps, and are possibly related to an ongoing interaction with a faint companion (see Appendix A). Apart from this region, a velocity gradient of Δv ∼ 70 km s−1 along the North-North-West to South-South-East direction is visible in both the narrow [O III] and Hα, possibly indicative of rotation. There is a small offset between the integrated [O III] and Hα line centroids of about 8 km s−1. We find elevated velocity dispersions in the galaxy centre, as expected for observations of a rotating disc affected by beam smearing. The outflow is visible in the nuclear region, with positive and negative velocities respectively the systemic velocity of |600–700| km s−1.
Current usage metrics show cumulative count of Article Views (full-text article views including HTML views, PDF and ePub downloads, according to the available data) and Abstracts Views on Vision4Press platform.
Data correspond to usage on the plateform after 2015. The current usage metrics is available 48-96 hours after online publication and is updated daily on week days.
Initial download of the metrics may take a while.