Fig. 2.
Download original image
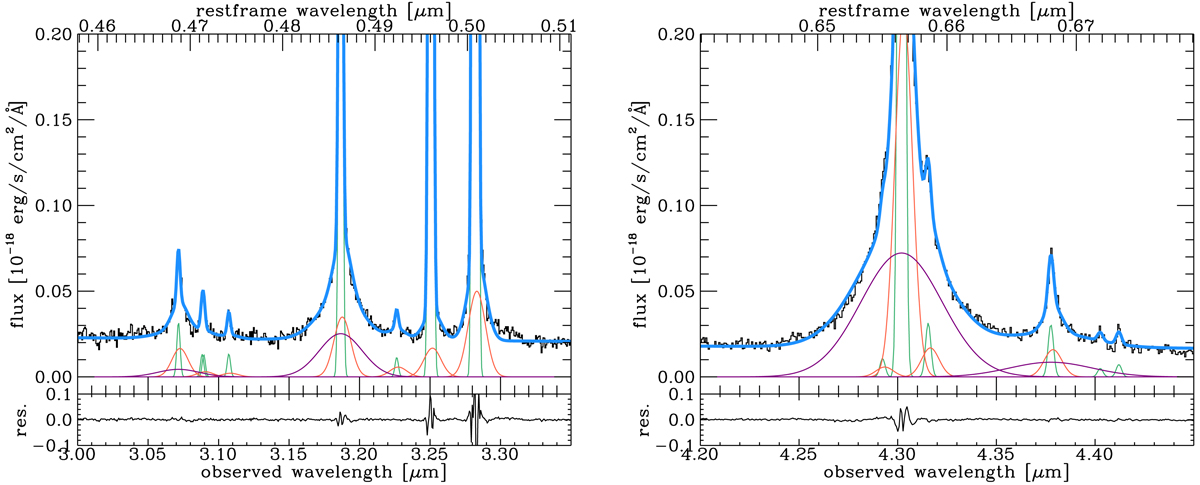
Zoom-in of the integrated spectrum extracted from the central three by three spaxels including our best fit (blue) with individual components for the emission lines (narrow: green, outflow: orange, BLR: purple) for different wavelength ranges. Left panel: Wavelength range including He IIλ4686, [Ar IV]λ4711, He Iλ4713, [Ar IV]λ4740, Hβ, He Iλ4922, [O III]λ4959, and [O III]λ5007. Right panel: Wavelength range including [N II]λ6548, Hα, [N II]λ6584, He Iλ6678, [S II]λ6716, and [S II]λ6731. The bottom sections of each panel show the residuals, res. = data – best fit. We note that for some of the weaker lines, no BLR or outflow component was preferred by the fit. We further note a faint flux excess red-wards of [O III]λ5007 that is undetected in individual spaxels, potentially suggesting some higher velocity (nuclear) outflow components not captured by our fiducial fit.
Current usage metrics show cumulative count of Article Views (full-text article views including HTML views, PDF and ePub downloads, according to the available data) and Abstracts Views on Vision4Press platform.
Data correspond to usage on the plateform after 2015. The current usage metrics is available 48-96 hours after online publication and is updated daily on week days.
Initial download of the metrics may take a while.