Fig. 1.
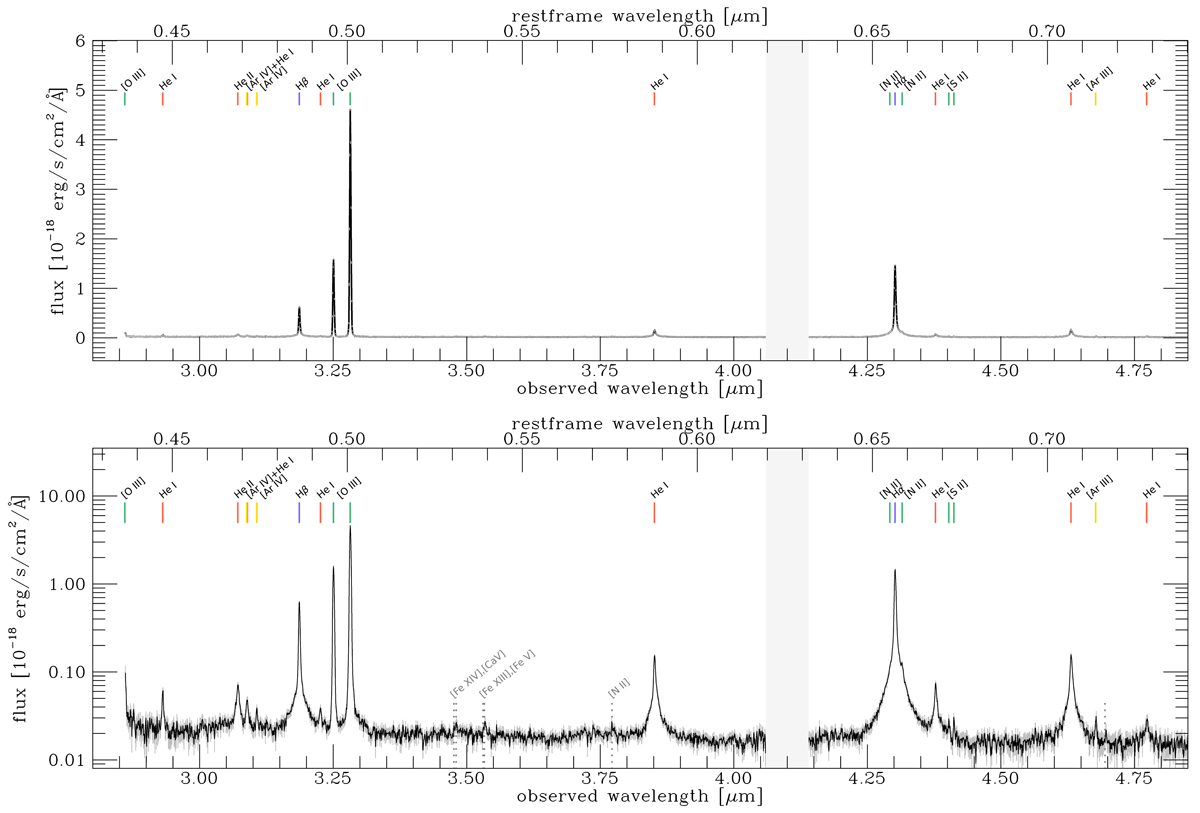
Download original image
Integrated spectrum extracted from the central three by three spaxels in the wavelength range 2.86 μm < λ < 4.85 μm with flux in linear scale (top) and log scale (bottom). Several emission lines are present and indicated by vertical lines at the top of the panels. We detected seven He I lines, He IIλ4686, Hβ, [O III]λλ4959, 5007, Hα, [N II]λλ6548, 6583, and [S II]λλ6716, 6731. We also report the detection of [Ar IV]λ4711, [Ar IV]λ4740, and [Ar III]λ7136. (We note that [Ar IV]λ4711 is blended with He Iλ4713.) The auroral line [O III]λ4363 is only partly covered by the spectral band of our observation with the G395H grating. The line [O I]λ6003 falls into the detector gap masked here in the region 4.06 μm < λ < 4.14 μm. The BLR components are present in Hβ, Hα, He II, and in the He I lines. In addition, an outflow component is present and is best visible in the broadened asymmetric line base of the [O III] doublet. In the bottom panel, we indicate with grey dotted vertical lines the positions of possible coronal lines, [Fe XVI], [Ca V], [Fe XIII], [Fe V]; of an auroral line, [N II]λ5755; and of another line at λ ∼ 7167.5 Å, the position of which is consistent with Si I.
Current usage metrics show cumulative count of Article Views (full-text article views including HTML views, PDF and ePub downloads, according to the available data) and Abstracts Views on Vision4Press platform.
Data correspond to usage on the plateform after 2015. The current usage metrics is available 48-96 hours after online publication and is updated daily on week days.
Initial download of the metrics may take a while.