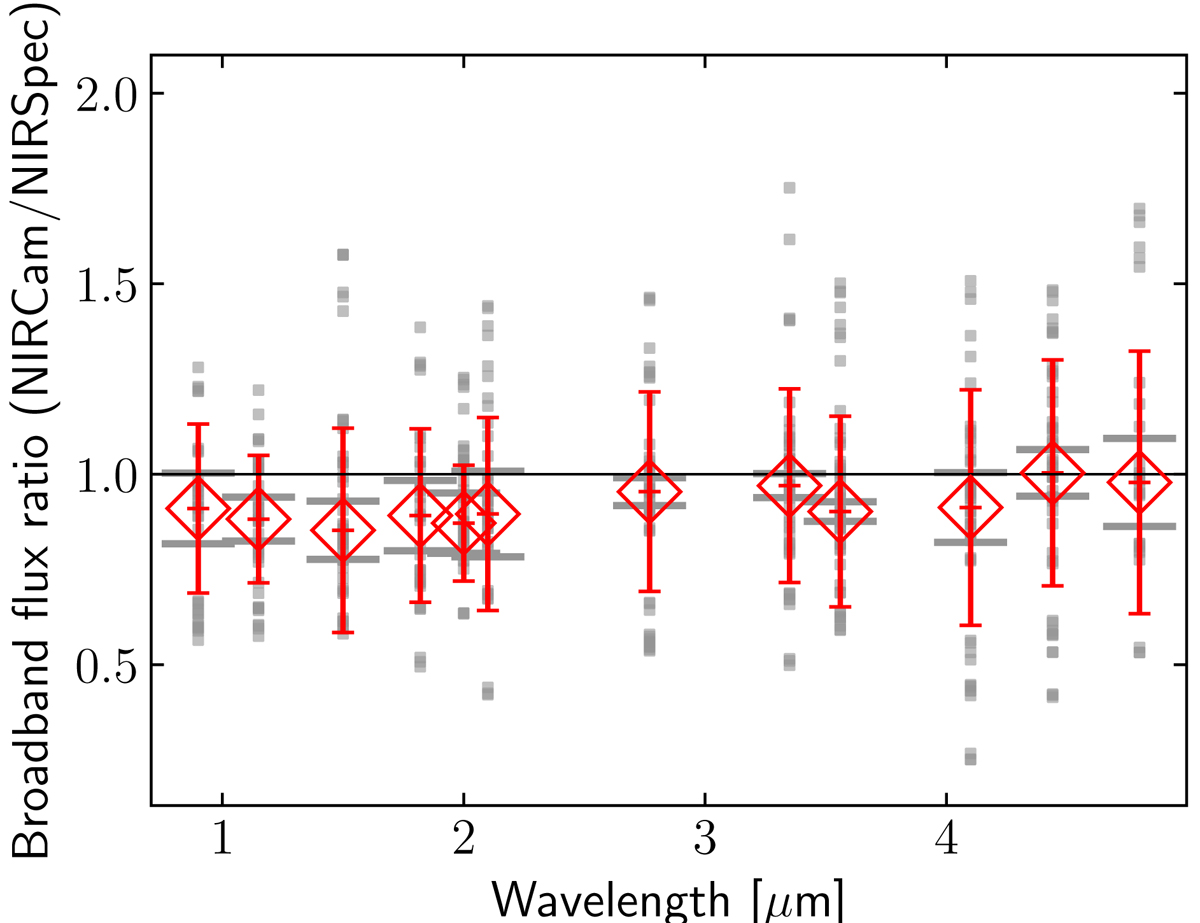
Fig. C.1.
Download original image
Ratio of apodised broad-band fluxes extracted from the projected MSA shutter regions on the NIRCam imaging compared to fluxes obtained from convolving PRISM/CLEAR spectra with the NIRCam filer transmission curves. Refer to the text for more details. Grey points show values derived for each independent pointing of each galaxy targeted in this work. Horizontal grey marks indicate the typical 1-σ measurement uncertainty on the individual measurements in each filter (which encompasses uncertainties from both NIRCam and NIRSpec). Red diamonds and errorbars show the median and standard deviation for each filter.
Current usage metrics show cumulative count of Article Views (full-text article views including HTML views, PDF and ePub downloads, according to the available data) and Abstracts Views on Vision4Press platform.
Data correspond to usage on the plateform after 2015. The current usage metrics is available 48-96 hours after online publication and is updated daily on week days.
Initial download of the metrics may take a while.