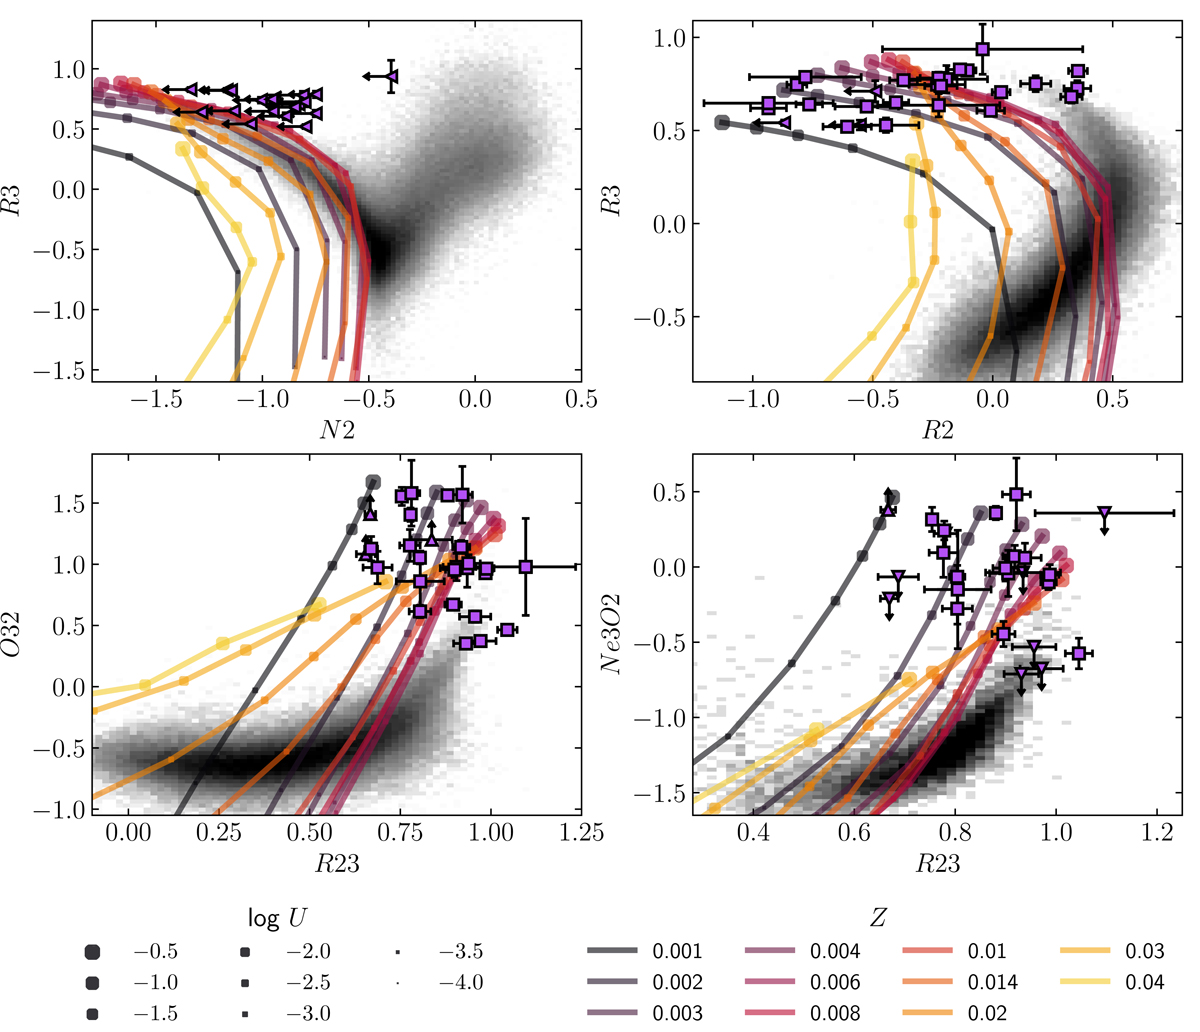
Fig. 7.
Download original image
JADES z ∼ 5.5 − 9.5 galaxies compared to photoionisation models. Measured ratios are shown as purple points, as in Figs. 3–6 except that all galaxies are plotted in the same colour, regardless of redshift. SDSS galaxies are shown in the same manner as Figs. 3–6. Each line shows a set of models with constant metallicity with values of Z = [1, 2, 3, 4, 6, 8, 10, 14, 20, 30, 40] × 10−3 increasing from black to yellow. Assuming Z⊙ = 0.0134 (Asplund et al. 2009), these correspond to Z/Z⊙ = 0.07, 0.15, 0.22, 0.30, 0.45, 0.60, 0.75, 1.0, 1.5, 2.2, 3.0. Ionisation parameter varies along the grid line, increasing with marker size, with values of log U = −4.0, −3.5, −3.0, −2.5, −2.0, −1.5, −1.0, −0.5. Details of the photoionisation models are described in Sect. 4.1.
Current usage metrics show cumulative count of Article Views (full-text article views including HTML views, PDF and ePub downloads, according to the available data) and Abstracts Views on Vision4Press platform.
Data correspond to usage on the plateform after 2015. The current usage metrics is available 48-96 hours after online publication and is updated daily on week days.
Initial download of the metrics may take a while.