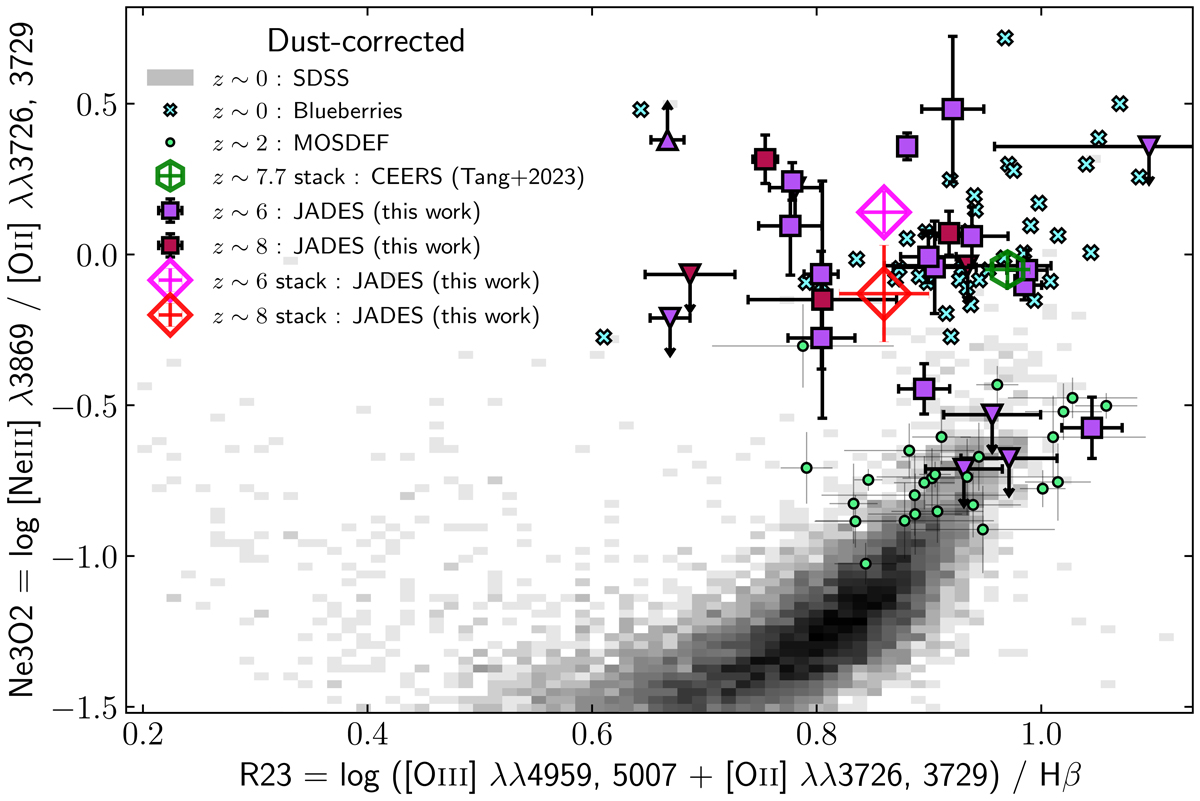
Fig. 6.
Download original image
R23–Ne3O2 diagram, probing the ionisation and excitation of the ISM. R23–Ne3O2 closely resembles the R23–O32 diagram with the additional advantage that the [Ne III] λ3869/[O II] λλ3726,329 ratio is less sensitive to the applied dust-correction, or any wavelength-dependent flux calibrations. JADES galaxies are plotted as in Fig. 5. Fewer literature samples present [Ne III] ratios so we show only SDSS, blueberries, MOSDEF, and the z ∼ 7.7 composite CEERS spectrum from Tang et al. (2023). These are each plotted in the same way as in previous figures.
Current usage metrics show cumulative count of Article Views (full-text article views including HTML views, PDF and ePub downloads, according to the available data) and Abstracts Views on Vision4Press platform.
Data correspond to usage on the plateform after 2015. The current usage metrics is available 48-96 hours after online publication and is updated daily on week days.
Initial download of the metrics may take a while.