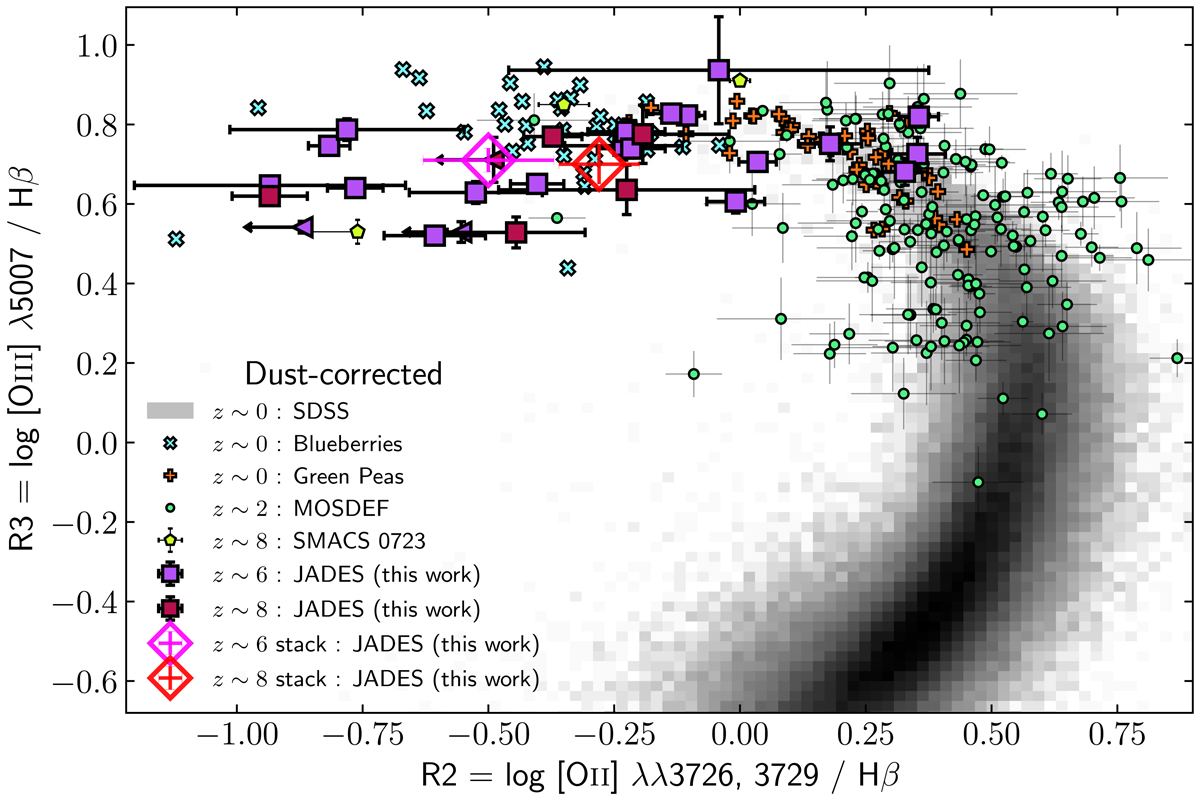
Fig. 4.
Download original image
R2–R3 diagram showing our two JADES sub-samples at z ∼ 6 (purple points) and z ∼ 8 (maroon points). Comparison samples from SDSS and MOSDEF are shown as in Fig. 3. We additionally show comparison with two populations of z ∼ 0 extreme starbursts: green peas (Yang et al. 2017a; orange plusses) and blueberries (Yang et al. 2017b; blue crosses). The three well-studied z > 7.5 galaxies from the SMACS 0723 ERO observations are shown as lime green pentagons, adopting the ratio values presented by Nakajima et al. (2023). Unlike the BPT and VO87 diagrams, the majority of our sample have > 3σ detections of all lines in individual spectra, revealing a large diversity within the sample. Ratios measured from stacked JADES spectra are shown as the open magenta and red diamonds (see Sect. 2.5).
Current usage metrics show cumulative count of Article Views (full-text article views including HTML views, PDF and ePub downloads, according to the available data) and Abstracts Views on Vision4Press platform.
Data correspond to usage on the plateform after 2015. The current usage metrics is available 48-96 hours after online publication and is updated daily on week days.
Initial download of the metrics may take a while.