Fig. 2.
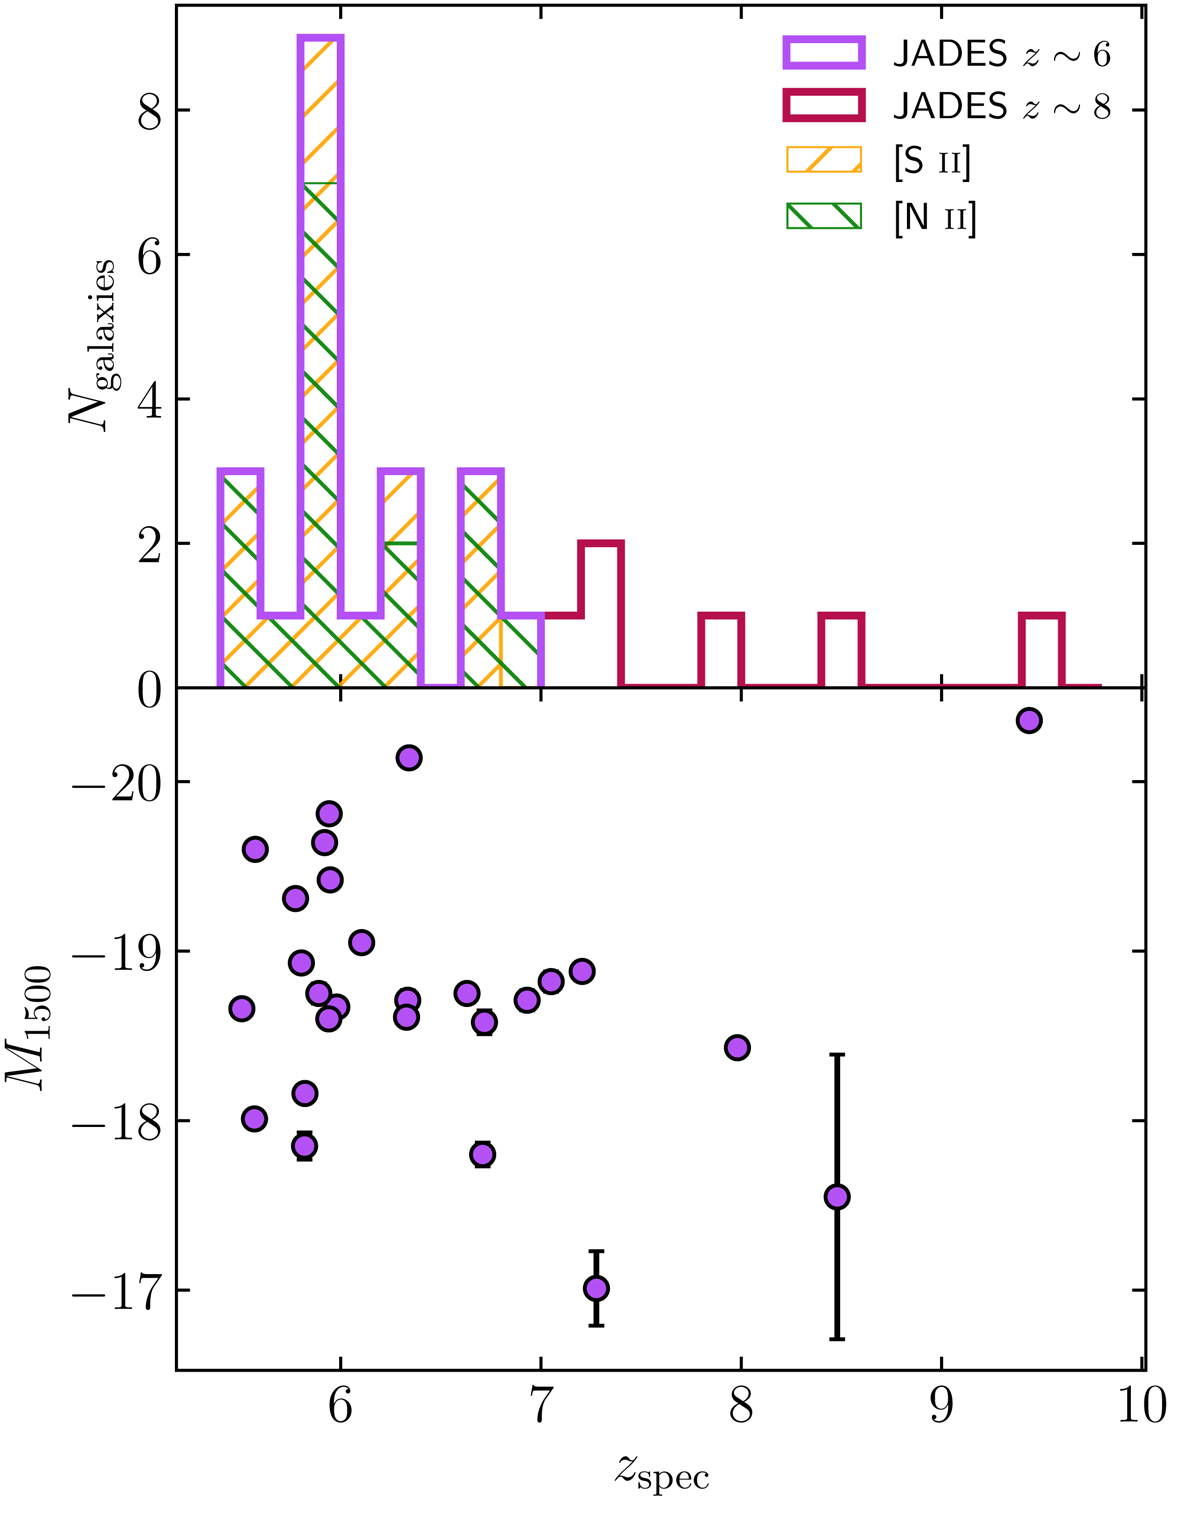
Download original image
Redshift and magnitude distribution of the 27 galaxies in our JADES sample. Top: redshift histogram of galaxies observed in this study. We divide the sample into two sub-samples ‘z∼6’ and ‘z ∼ 8’, based simply on cutting at z = 7 since this is the redshift at which Hα is redshifted beyond the spectral coverage of NIRSpec. Thus, for JADES ‘z ∼ 8’ we only have coverage of lines from [O II] λλ3726, 3729 to [O III] λ5007, while for JADES ‘z ∼ 6’ we can in principle observe all the rest-frame optical lines out to [S II] λλ6716, 6731. The orange hatched histogram indicates galaxies for which we can constrain the [S II] λλ6716, 6731 flux. Green hatching is the same but for [N II] λ6583. Bottom: redshift vs. M1500 for the full z ∼ 5.5 − 9.5 sample. We derived M1500 directly from the PRISM spectra as described in Sect. 2.4.1.
Current usage metrics show cumulative count of Article Views (full-text article views including HTML views, PDF and ePub downloads, according to the available data) and Abstracts Views on Vision4Press platform.
Data correspond to usage on the plateform after 2015. The current usage metrics is available 48-96 hours after online publication and is updated daily on week days.
Initial download of the metrics may take a while.