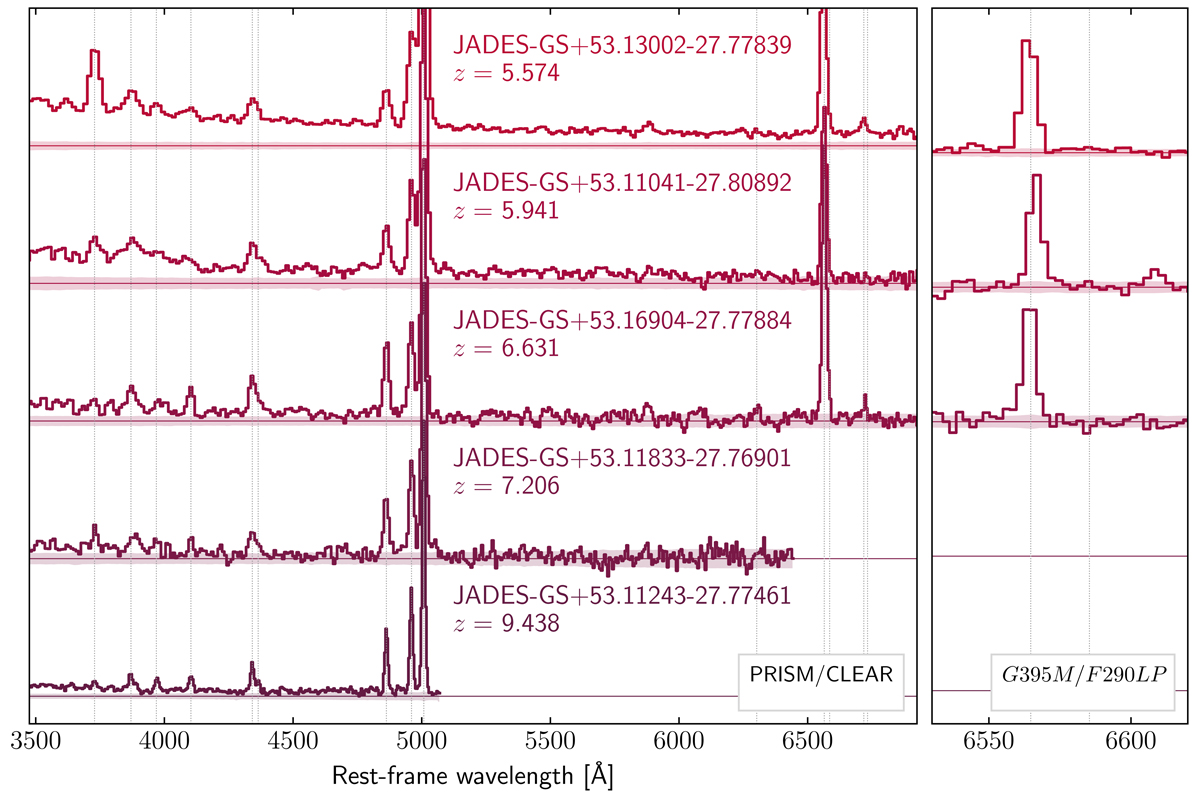
Fig. 1.
Download original image
Example spectra from five galaxies included in our sample. Left: low-resolution PRISM/CLEAR spectra shifted to the rest-frame according to the observed redshift. Flux is shown in fλ but has been renormalised relative to the peak flux from the [O III] λ5007 line. Solid horizontal lines show the zero flux of each spectrum. The shaded region around the ‘zero’ line indicates the 1-σ noise spectrum in the same renormalised units. We show only the subset of spectral coverage that includes the key emission lines used in this study. Vertical dotted lines show the expected centroids of the [O II] λ3727, [Ne III] λ3869, [Ne III] λ3967, Hδ, Hγ, [O III] λ4363, Hβ, [O III] λ4959, [O III] λ5007, [O I] λ6300, Hα, [N II] λ6583, [S II] λ6716, and [S II] λ6731 lines respectively (moving left to right). Right: zoom in on the Hα + [N II] complex as observed in the G395M/F290LP grating spectra of these same galaxies. Observed spectra are shown in the same way as for the left panel (except renormalised to Hα, rather than [O III]). Vertical dotted lines show the expected centroids of Hα and [N II] λ6583.
Current usage metrics show cumulative count of Article Views (full-text article views including HTML views, PDF and ePub downloads, according to the available data) and Abstracts Views on Vision4Press platform.
Data correspond to usage on the plateform after 2015. The current usage metrics is available 48-96 hours after online publication and is updated daily on week days.
Initial download of the metrics may take a while.