Fig. 9
Download original image
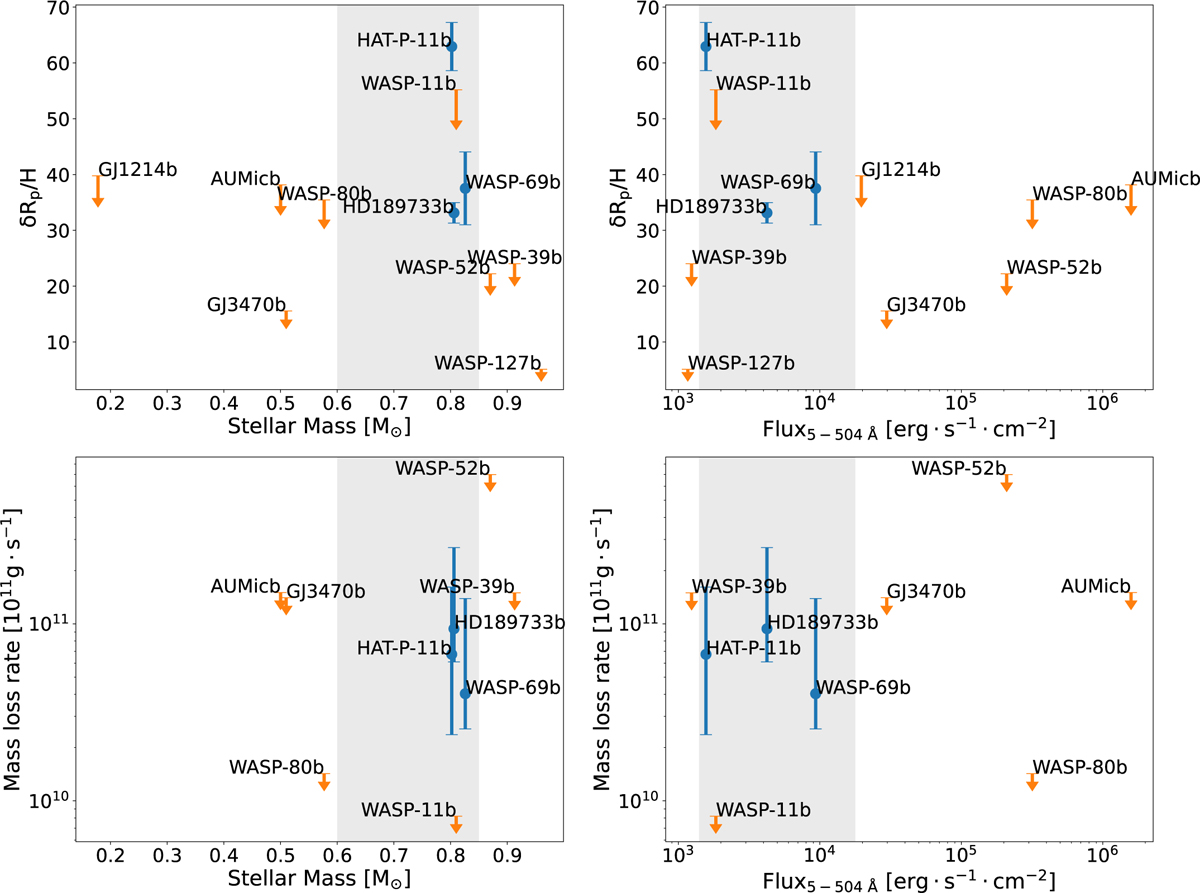
Correlation plots for the eleven planets studied in this paper. Detections are shown as blue points and upper limits as orange points. We pinpointed with a gray area the parameter space that seems to favor the detection of metastable helium in exoplanet atmospheres. Top left: δRp/H as a function of the stellar mass. Top right: δRp/H as a function of XUV flux received from 5 to 504 A. Bottom left: mass-loss rate derived from the p–winds simulations as a function of the stellar mass. Bottom right: mass-loss rate derived from the p–winds simulations as a function of XUV flux received from 5 to 504 Å.
Current usage metrics show cumulative count of Article Views (full-text article views including HTML views, PDF and ePub downloads, according to the available data) and Abstracts Views on Vision4Press platform.
Data correspond to usage on the plateform after 2015. The current usage metrics is available 48-96 hours after online publication and is updated daily on week days.
Initial download of the metrics may take a while.