Fig. 6
Download original image
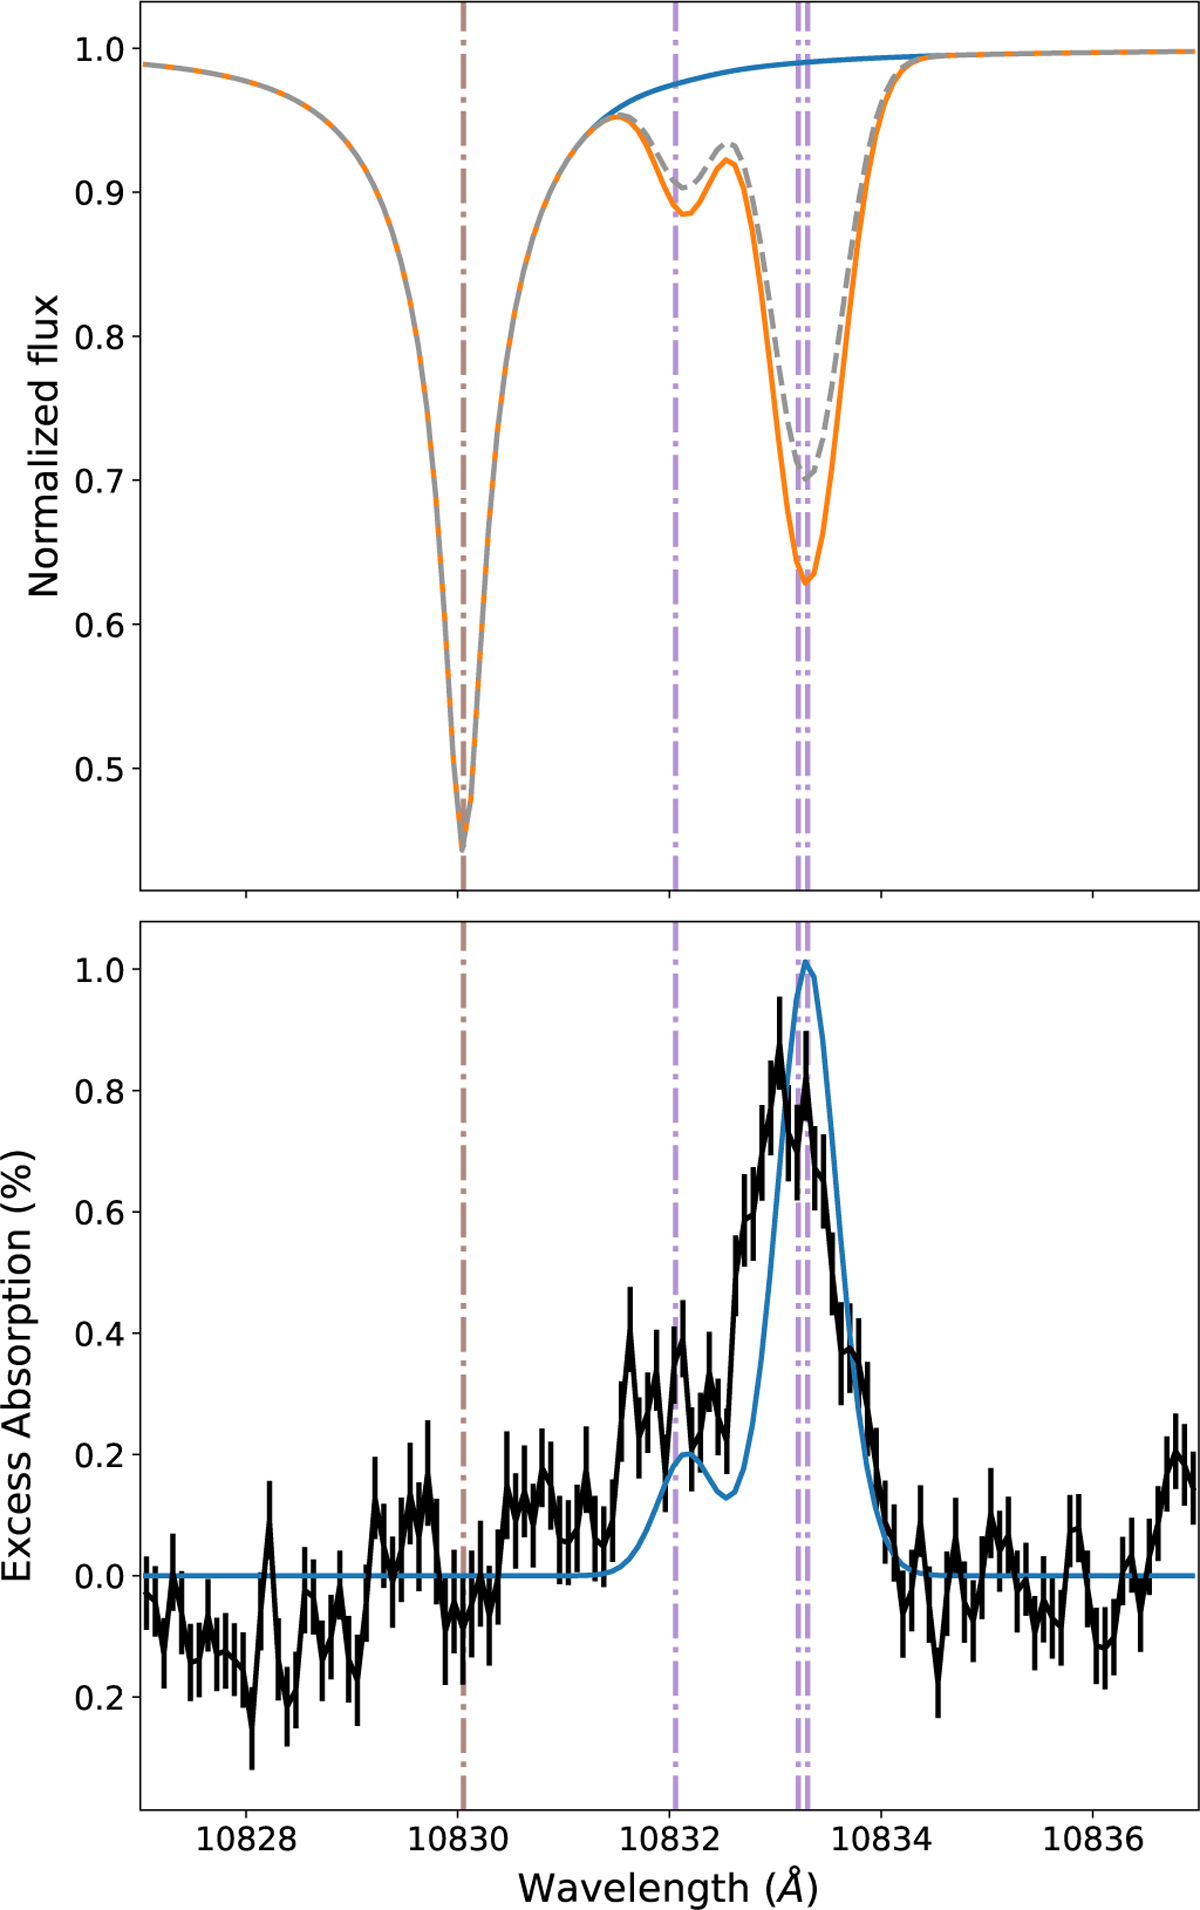
Impact of stellar pseudo-signal on the transmission spectrum of HD 189733 b. Top: stellar master spectrum (black dots) with the modeled stellar spectra of bright (orange) and dark (blue) regions and both combined (dashed gray) for a filling factor of 0.8. Bottom: observed transmission spectrum in black. Average transmission spectrum caused by stellar pseudo-absorption (blue) signal. The dashed-dotted brown line is at the position of the Si I line and the dashed-dotted purple lines are at the position of the He I lines in the star (top) and planet (bottom) rest frame.
Current usage metrics show cumulative count of Article Views (full-text article views including HTML views, PDF and ePub downloads, according to the available data) and Abstracts Views on Vision4Press platform.
Data correspond to usage on the plateform after 2015. The current usage metrics is available 48-96 hours after online publication and is updated daily on week days.
Initial download of the metrics may take a while.