Fig. 2
Download original image
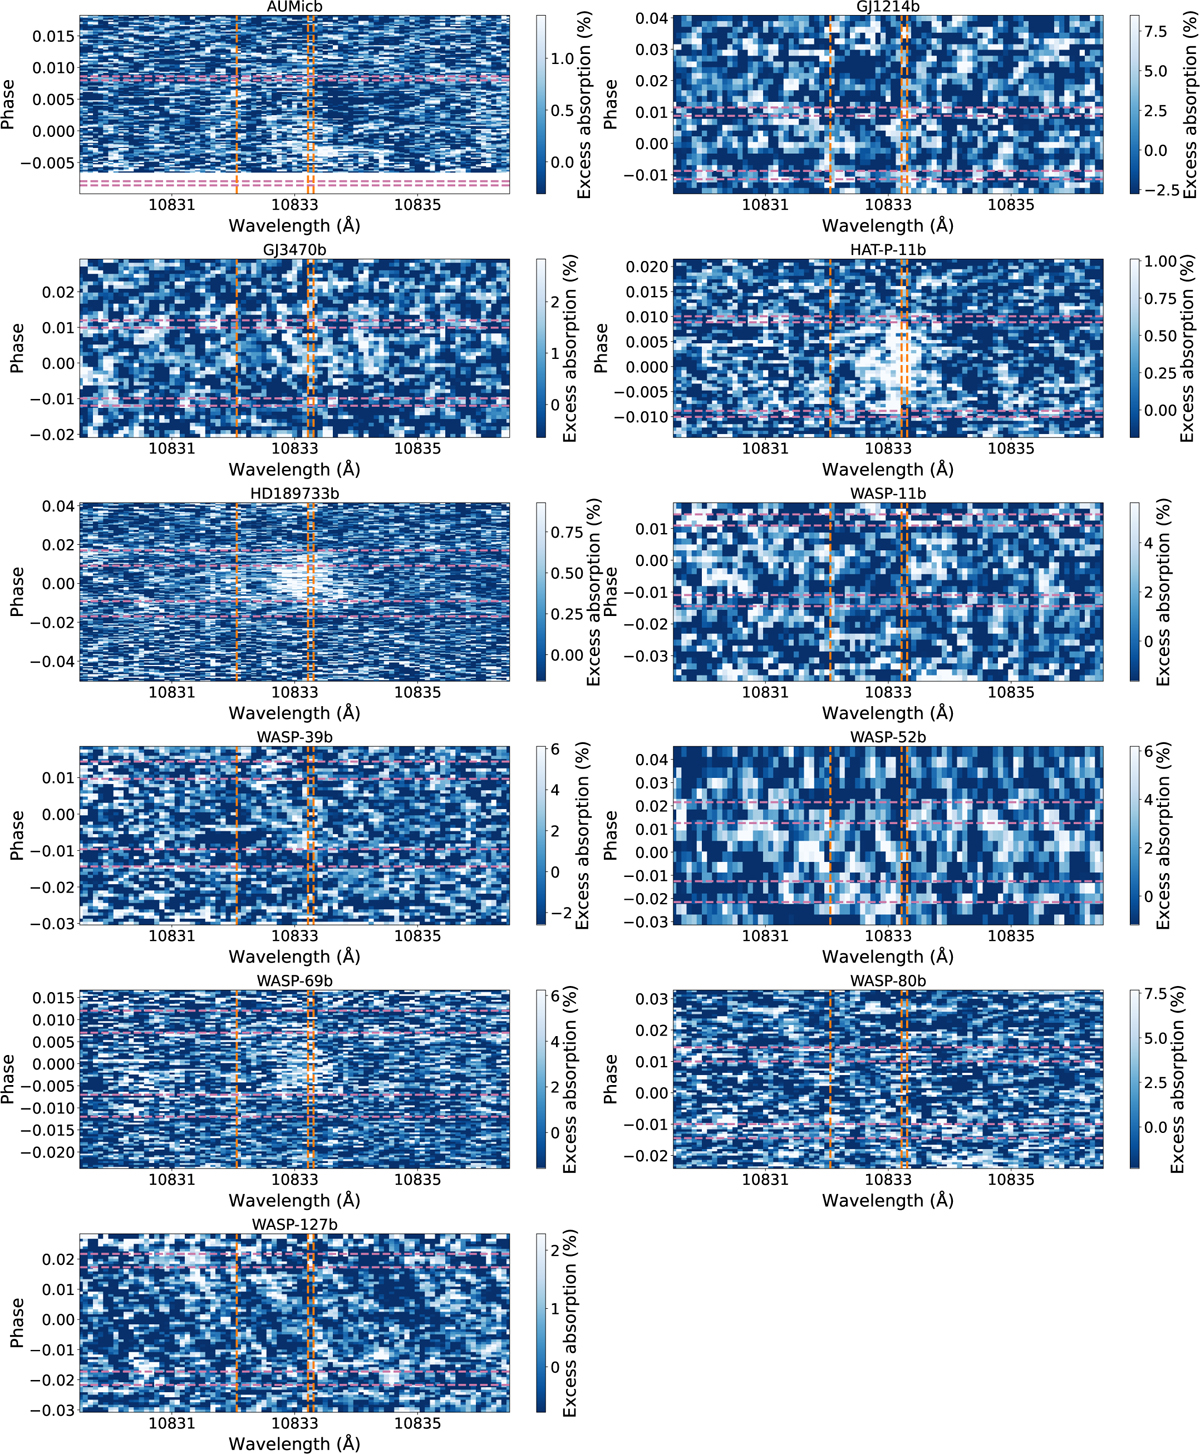
Transmission spectroscopy maps in the planet rest frame for the eleven planets. Detections are visible for HAT-P-11 b, HD 189733 b and WASP-69 b as white clusters. The pink dashed horizontal lines are the contact lines from bottom to top: t1, t2, t3, and t4. The vertical orange dashed lines indicate the helium lines’ positions.
Current usage metrics show cumulative count of Article Views (full-text article views including HTML views, PDF and ePub downloads, according to the available data) and Abstracts Views on Vision4Press platform.
Data correspond to usage on the plateform after 2015. The current usage metrics is available 48-96 hours after online publication and is updated daily on week days.
Initial download of the metrics may take a while.