Fig. C.1
Download original image
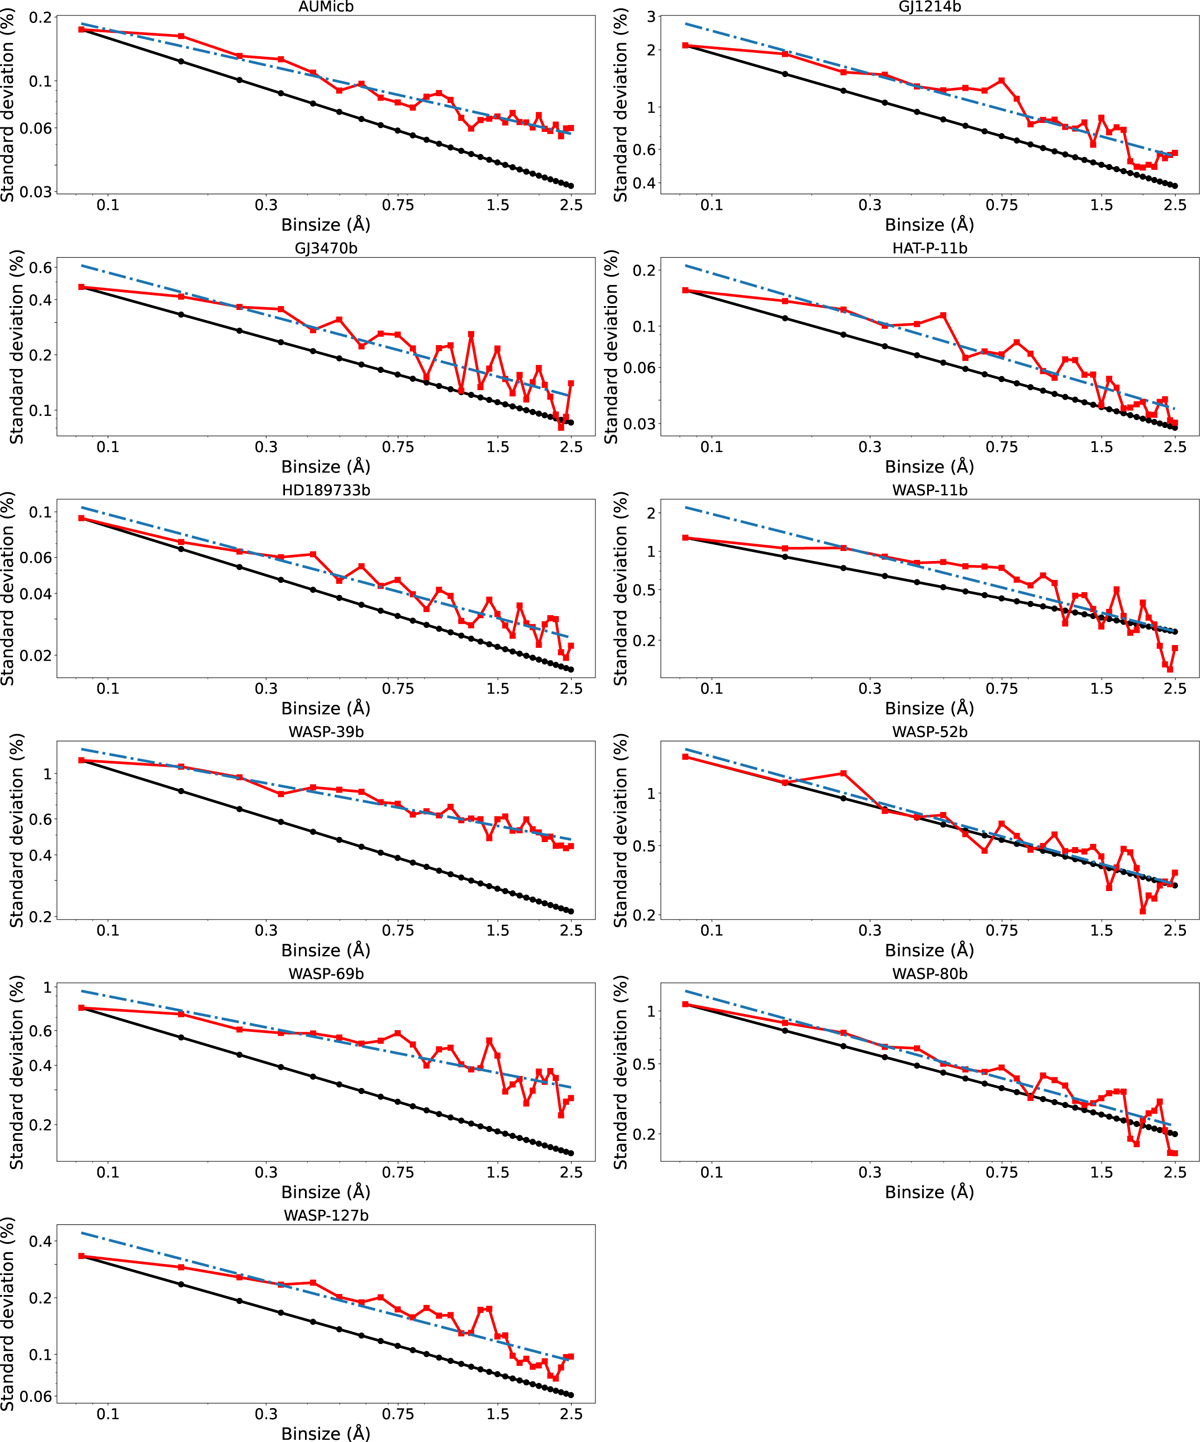
Allan plot estimated on the average transmission spectra of the eleven planets. The dark dotted lines correspond to the white noise as function of the bin size. The white noise on 1 original pixel is estimated as the standard deviation of the transmission spectrum. The red dotted curves are the standard deviation of the transmission spectrum after various binning size. The dashed blue lines are the best fit applied of the reds curves.
Current usage metrics show cumulative count of Article Views (full-text article views including HTML views, PDF and ePub downloads, according to the available data) and Abstracts Views on Vision4Press platform.
Data correspond to usage on the plateform after 2015. The current usage metrics is available 48-96 hours after online publication and is updated daily on week days.
Initial download of the metrics may take a while.