Fig. 9
Download original image
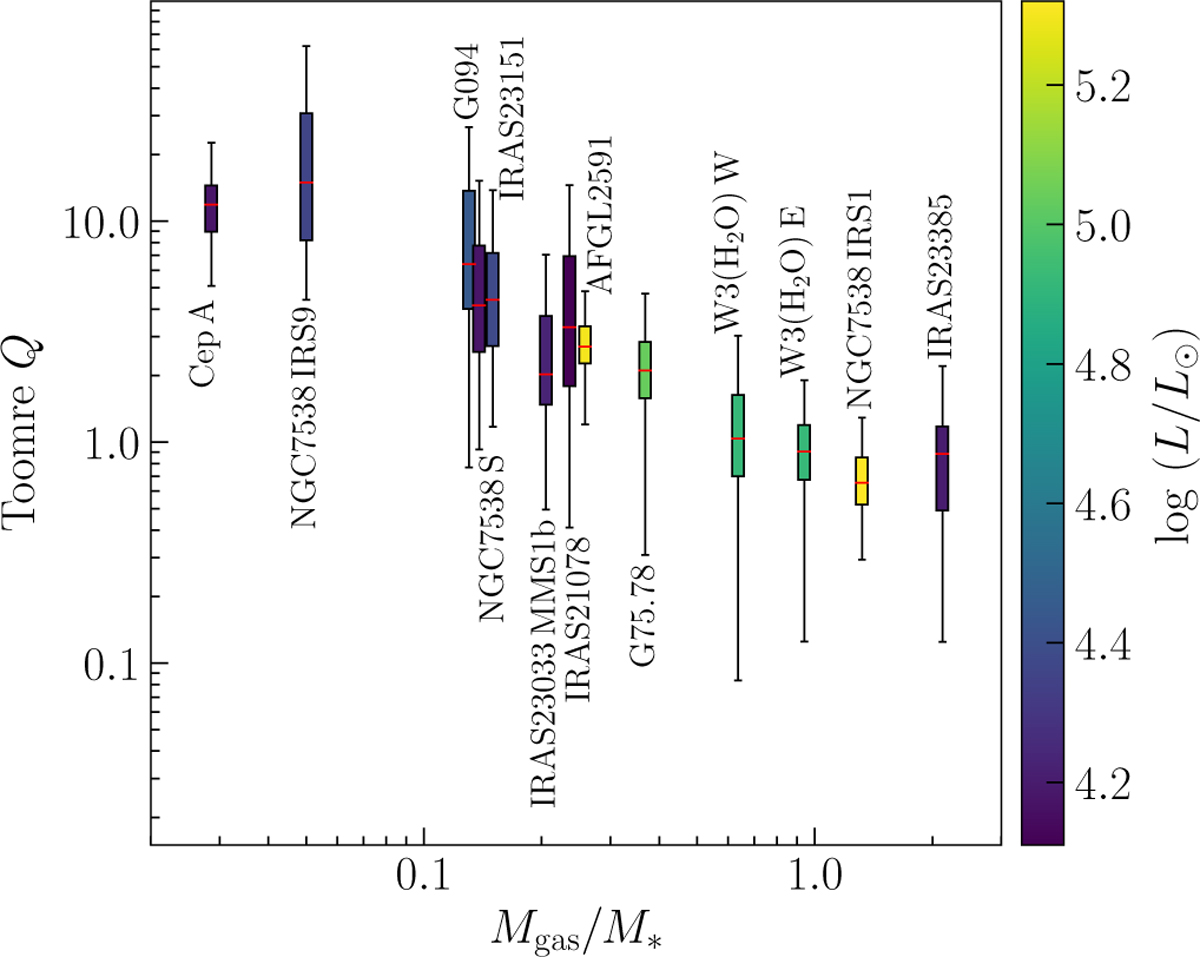
Box plot showing the Q distribution versus the ratio of gas to stellar mass, coloured according to the luminosity of the regions within which they reside. The boxes extend from the first to the third quartiles, with a red line at the median Q value. The whiskers extend from the box by ±1.5 times the box size. Disks with Q ≲ 2 are Toomre unstable (i.e. all but Cep A & NGC 753 8IRS9).
Current usage metrics show cumulative count of Article Views (full-text article views including HTML views, PDF and ePub downloads, according to the available data) and Abstracts Views on Vision4Press platform.
Data correspond to usage on the plateform after 2015. The current usage metrics is available 48-96 hours after online publication and is updated daily on week days.
Initial download of the metrics may take a while.