Fig. 6
Download original image Download original image
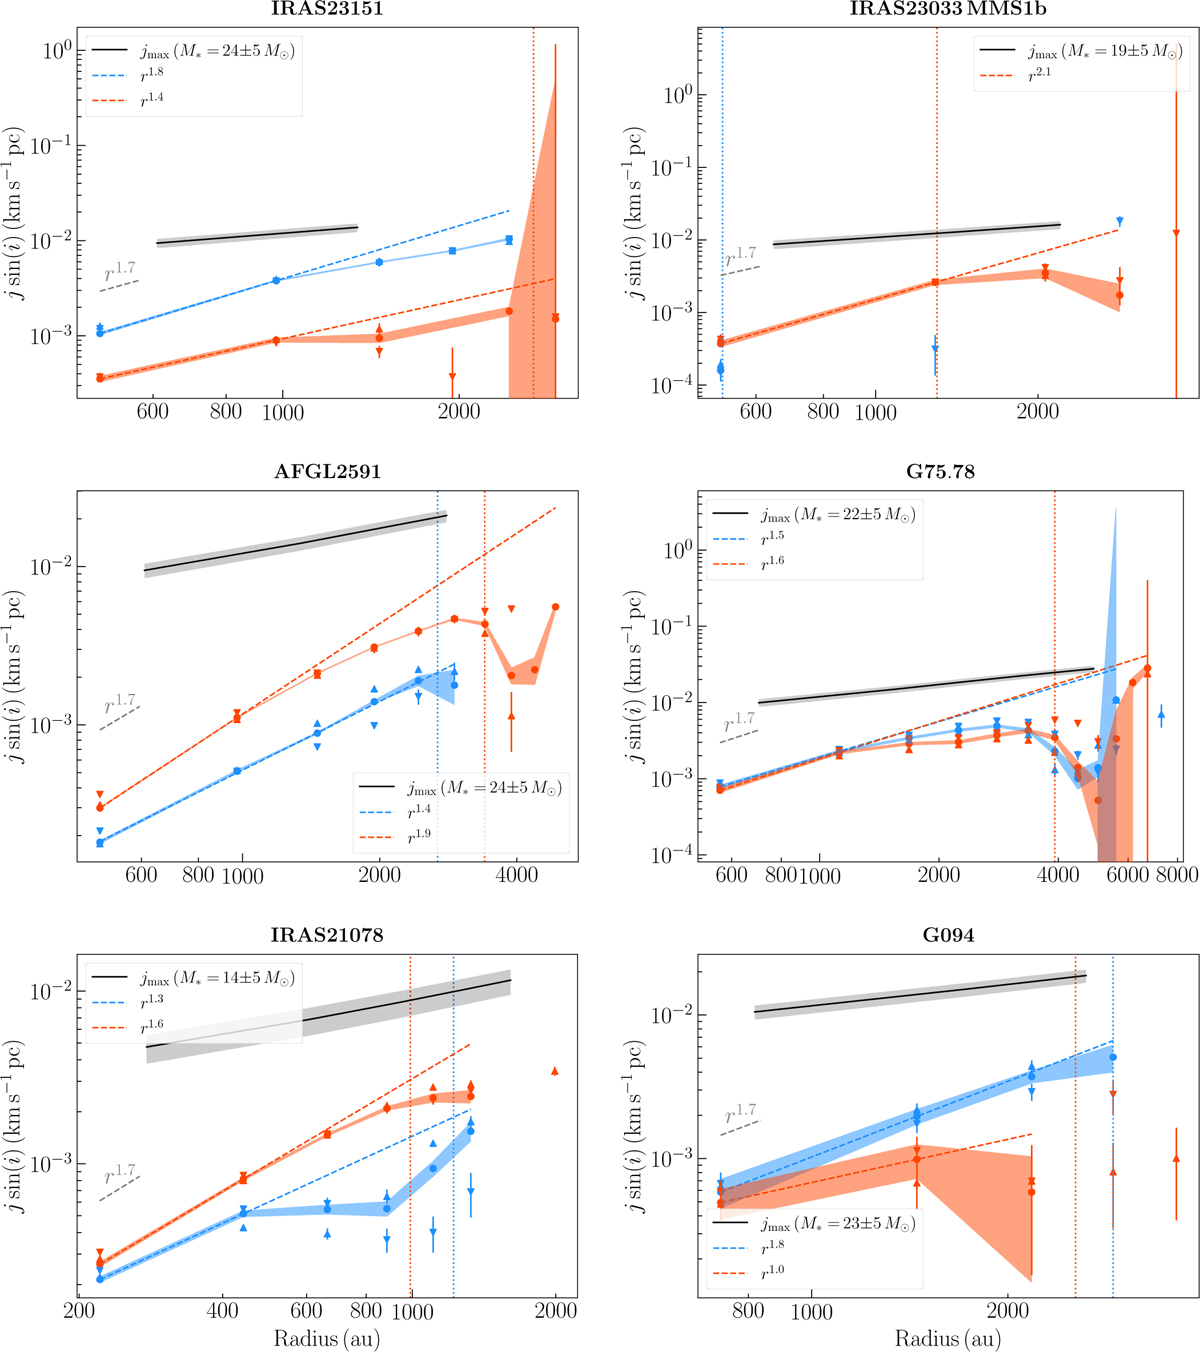
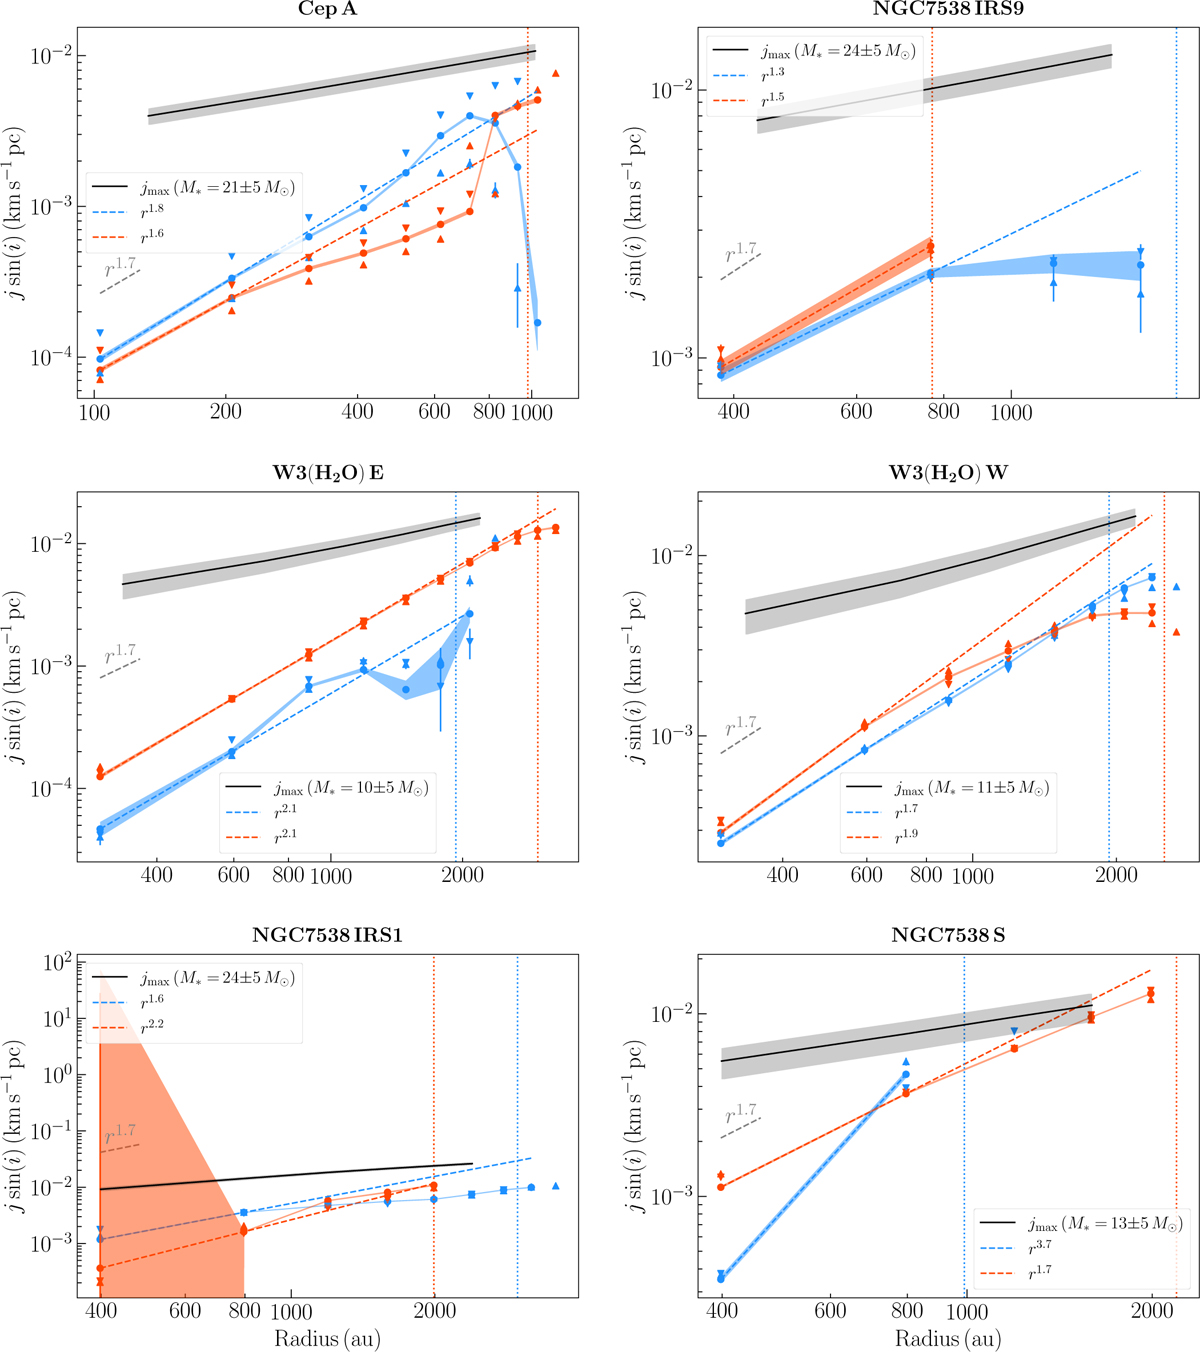
Specific angular momentum radial profiles calculated using Eq. (7) along the cut with the strongest velocity gradient (dotted lines in Fig. 4), (circles), a cut with position angle +10° (triangles pointing up), and a cut with position angle −10° (triangles pointing down) with respect to the strongest velocity gradient, for the redshifted (red) and blueshifted (blue) sides of the emission. The blue and red filled regions show the error in j sin(i) for the circles. We note that the inclinations are not corrected for as they are not known. The blue and red dashed lines show least-squared power-law fits to the first two data points and extrapolated to larger radii. The values of the fitted slopes are noted in the legends and listed in Table 6 along with the intercepts. The blue and red dotted vertical lines correspond to radii associated with the edges of the disks depicted with × markers in Fig. 2. The black curve shows the maximum specific angular momentum calculated using Eq. (8) for M* listed in the sub-panels with the grey region corresponding to M* ± 5 M⊙. The grey dashed line shows the j sin(i) ∝ r1.7 slope.
Current usage metrics show cumulative count of Article Views (full-text article views including HTML views, PDF and ePub downloads, according to the available data) and Abstracts Views on Vision4Press platform.
Data correspond to usage on the plateform after 2015. The current usage metrics is available 48-96 hours after online publication and is updated daily on week days.
Initial download of the metrics may take a while.