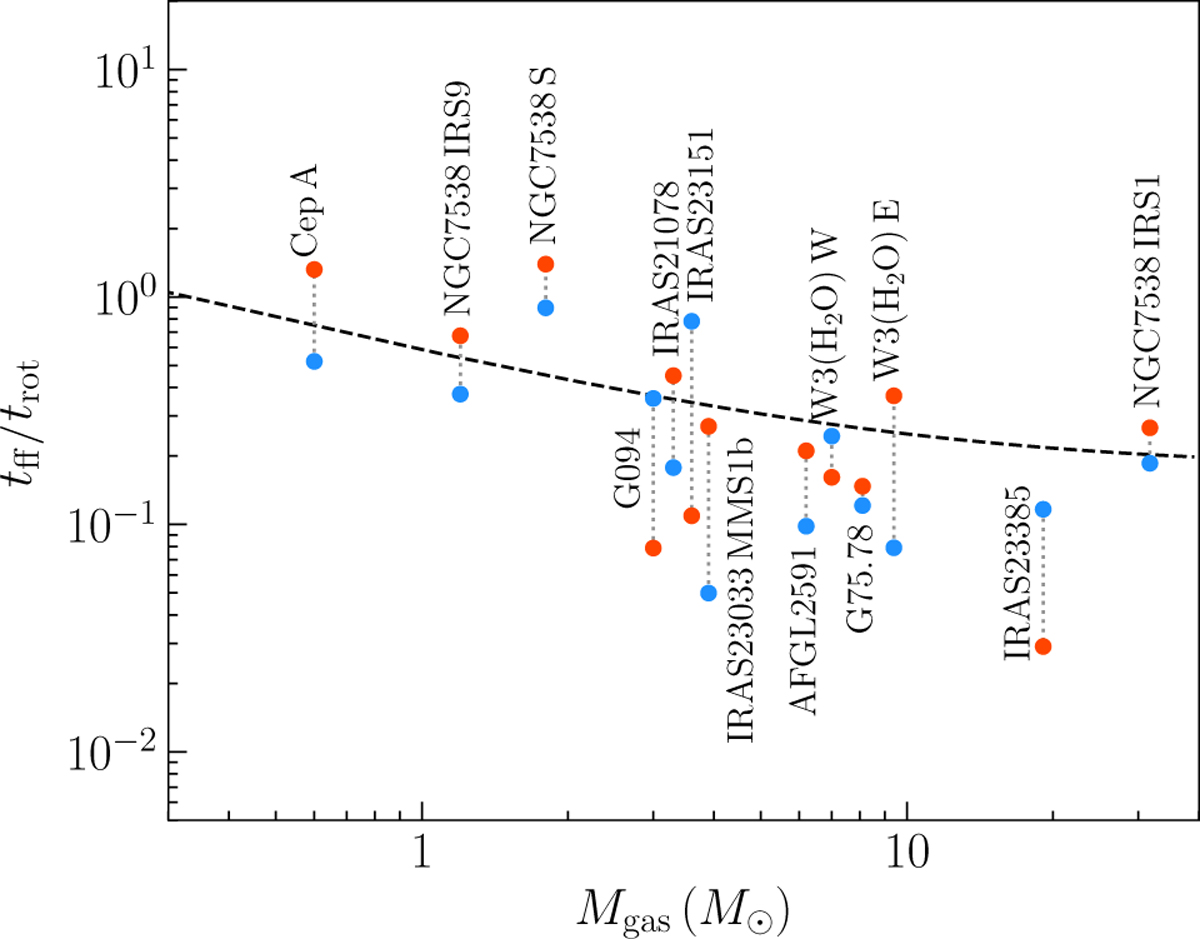
Fig. 5
Download original image
Ratio of free-fall to rotational timescale as a function of disk gas mass, showing most of the sources with CH3CN velocity gradients are rotationally supported. The blue and red dots correspond to the values calculated based on the rotational velocities at the edges of the disks on the blueshifted and redshifted sides, as depicted by crosses in Fig. 2 and listed in Table 3. The black dashed line corresponds to theoretical curve of tff/trot for a disk of mass Mgas in Keplerian rotation about a star with mass M* = 10 M⊙ (see Eq. (4)).
Current usage metrics show cumulative count of Article Views (full-text article views including HTML views, PDF and ePub downloads, according to the available data) and Abstracts Views on Vision4Press platform.
Data correspond to usage on the plateform after 2015. The current usage metrics is available 48-96 hours after online publication and is updated daily on week days.
Initial download of the metrics may take a while.