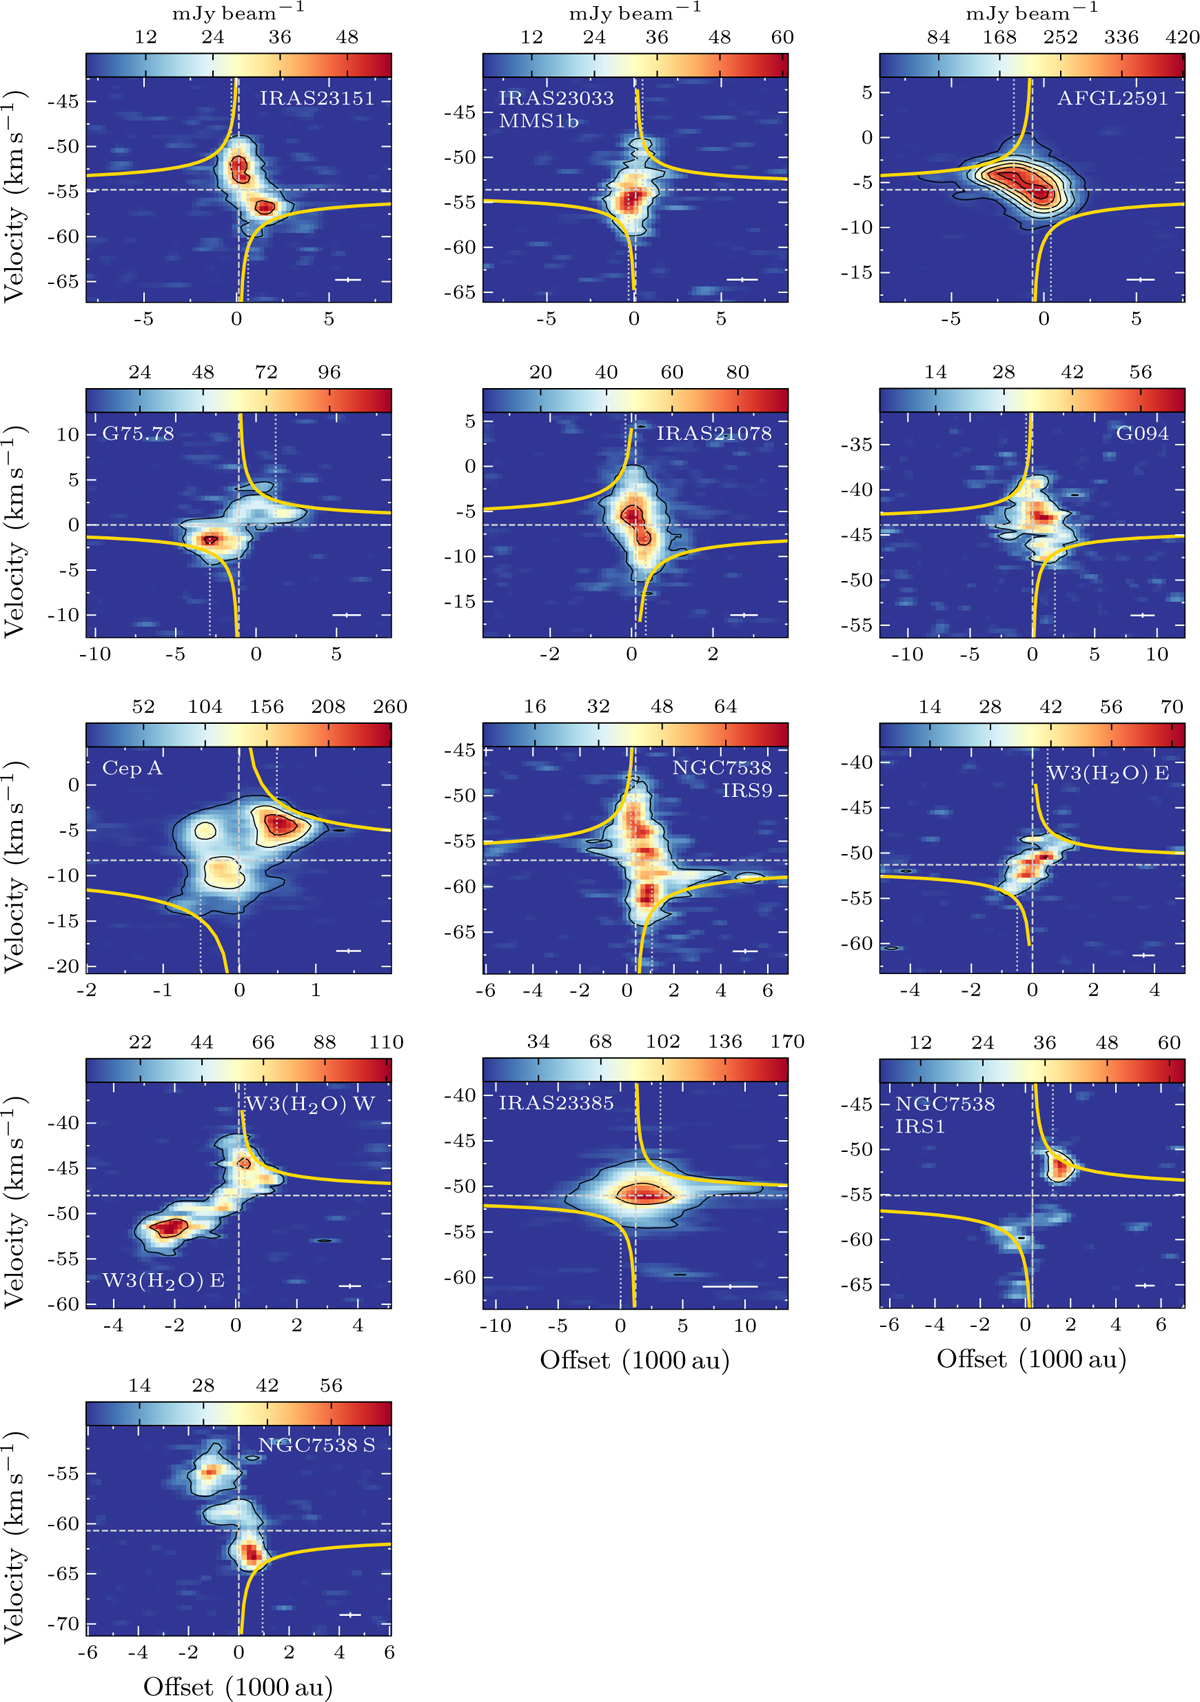
Fig. 4
Download original image
Position-velocity (PV) plots for best fitted transitions listed in Table 5 along cuts in the direction of rotation as depicted by dotted lines in Fig. 2. The width of the cut is the size of a synthesised beam to increase the signal-to-noise ratio. The PV plots of W3(H2O) E and W3(H2O) W make use of the A-array only observations in order to gain more resolution and disentangle the two cores from the circumbinary material. PV plots for all other sources make use of the full dataset observed in the CORE survey. The contours correspond to the 6σ level increasing in steps of 24σ. Yellow lines show the Keplerian rotation curves for enclosed masses, MPV, listed in Table 5 for each source. The inner radii that were masked out (i.e. excluded) in the fitting routine are shown as vertical dotted lines. The fitted central velocities and positions are shown as dashed lines. The zero offset corresponds to the continuum peak position. The crosses in the bottom right corners correspond to the spatial and spectral resolutions.
Current usage metrics show cumulative count of Article Views (full-text article views including HTML views, PDF and ePub downloads, according to the available data) and Abstracts Views on Vision4Press platform.
Data correspond to usage on the plateform after 2015. The current usage metrics is available 48-96 hours after online publication and is updated daily on week days.
Initial download of the metrics may take a while.