Fig. 3
Download original image
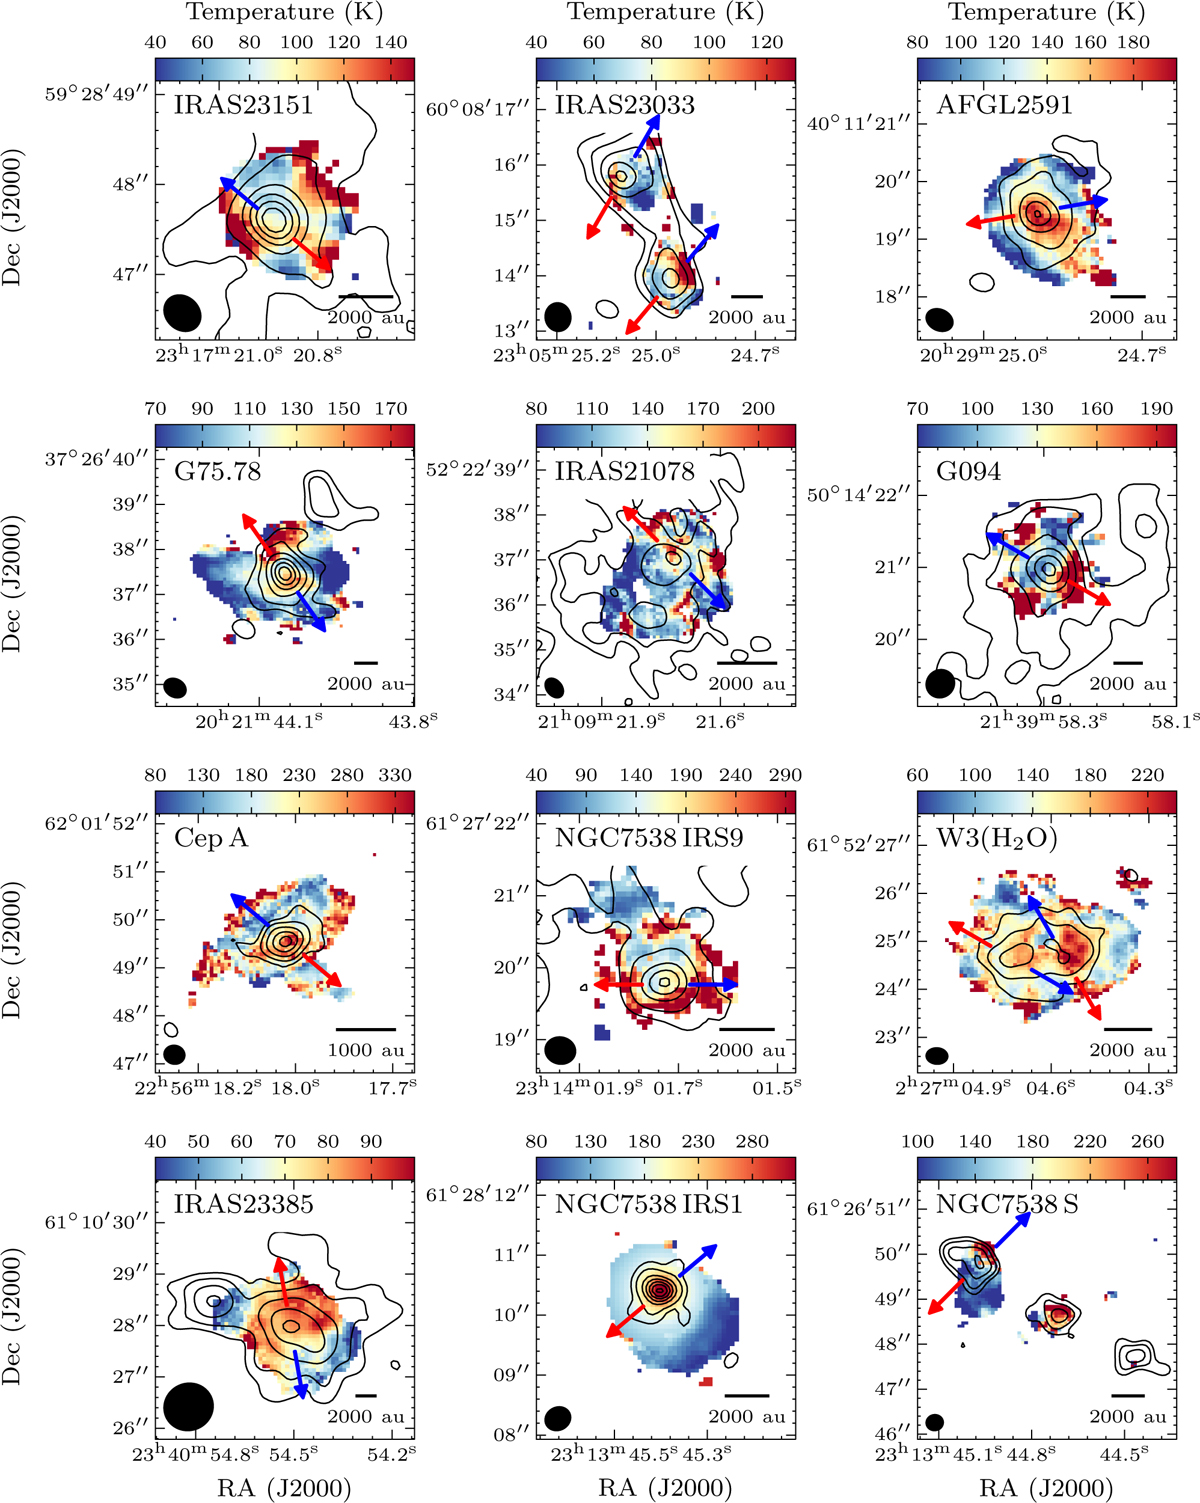
Rotational temperature maps obtained by fitting CH3CN (12K−11K) K = 0−6 and CH313CN (12K−11K) K = 0–3 lines with XCLASS. The contours correspond to the 1.37 mm continuum as described in Fig. 1. For NGC 7538IRS1, only the region outside the continuum to the south-west is modelled by XCLASS and was scaled towards the continuum peak position following a temperature power-law distribution T ∝ r−0.4. The blue and red arrows correspond to the estimated directions of bipolar blueshifted and redshifted molecular outflows, respectively. The synthesised beam is shown in the bottom left corner and a scale bar in the bottom right corner of each panel. Maps of column density, velocity offset, linewidth, and source size are shown in Appendix E.
Current usage metrics show cumulative count of Article Views (full-text article views including HTML views, PDF and ePub downloads, according to the available data) and Abstracts Views on Vision4Press platform.
Data correspond to usage on the plateform after 2015. The current usage metrics is available 48-96 hours after online publication and is updated daily on week days.
Initial download of the metrics may take a while.