Fig. E.4
Download original image
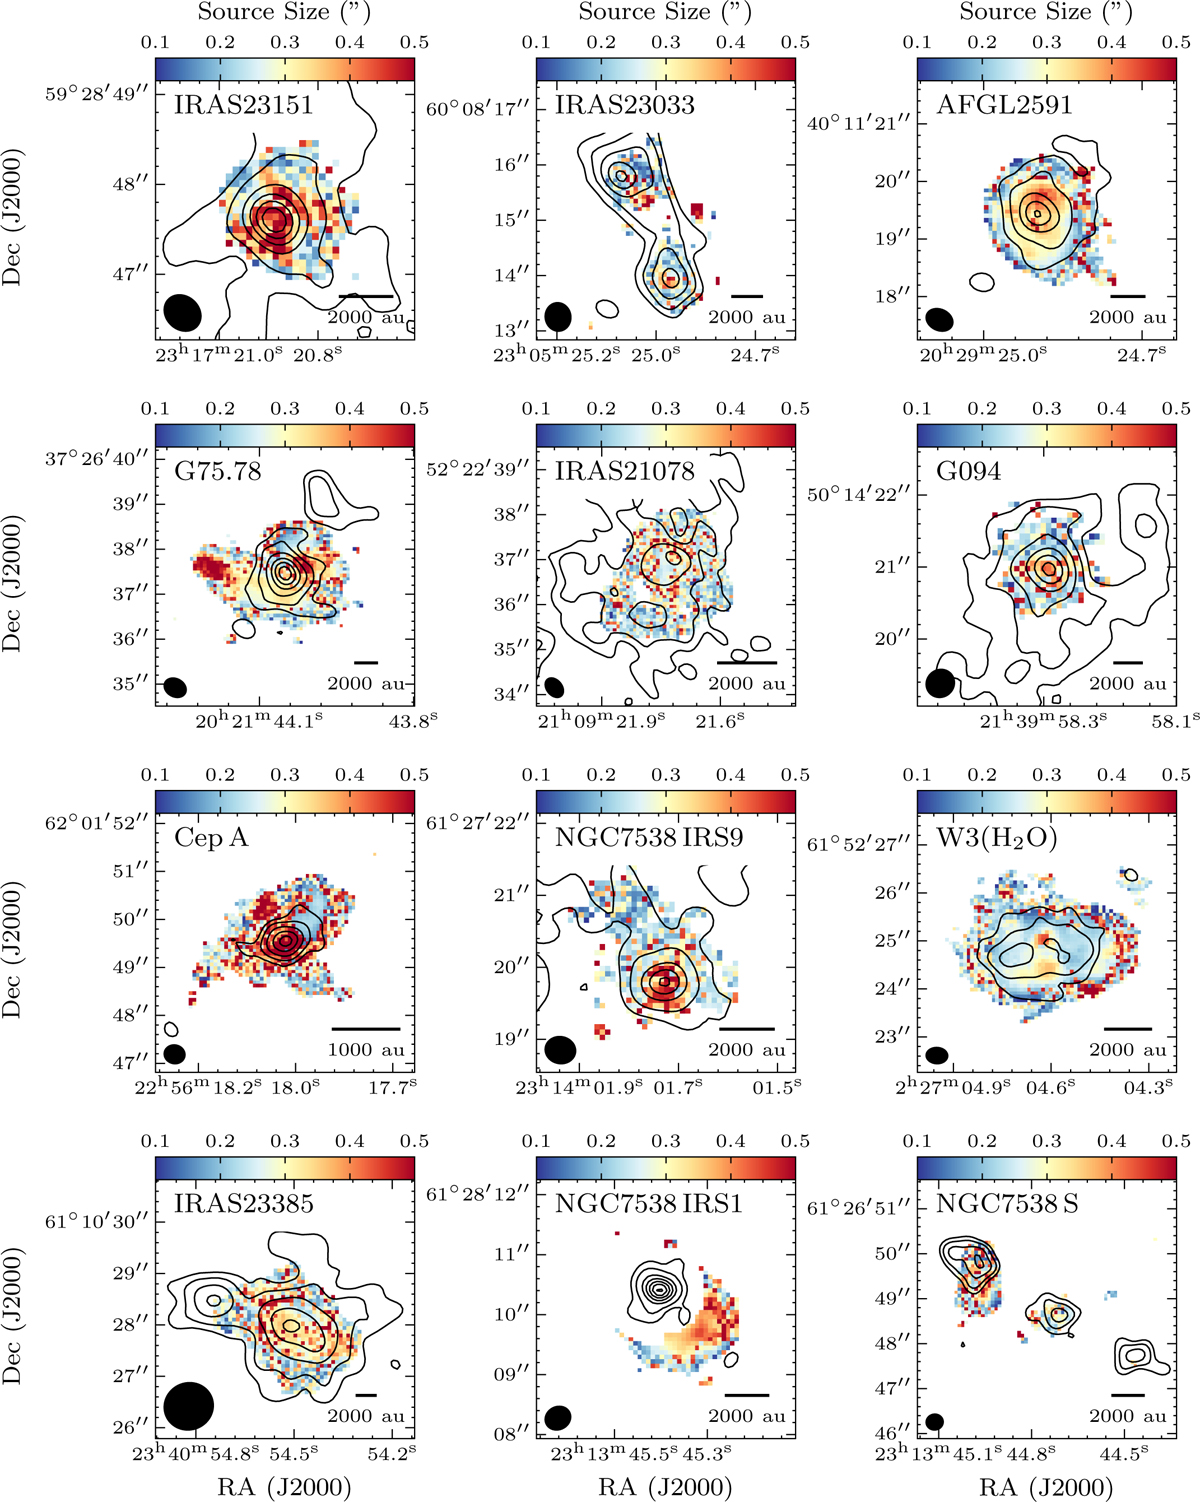
Maps of source size parameter obtained by fitting CH3CN (12K − 11K) K = 0 – 6 and CH313CN (12K − 11K) K = 0 – 3 lines with XCLASS for the best disk candidates in the CORE survey. The contours correspond to the 1.37 mm continuum as described in Fig. 1. For NGC7538 IRS1, only the region outside the continuum to the south-west is modelled by XCLASS as the molecular lines are seen in absorption against the strong continuum source with many velocity components due to the complex dynamics in this source. The synthesised beam is shown in the bottom left corner and a scale bar in the bottom right corner of each panel.
Current usage metrics show cumulative count of Article Views (full-text article views including HTML views, PDF and ePub downloads, according to the available data) and Abstracts Views on Vision4Press platform.
Data correspond to usage on the plateform after 2015. The current usage metrics is available 48-96 hours after online publication and is updated daily on week days.
Initial download of the metrics may take a while.