Fig. C.4
Download original image
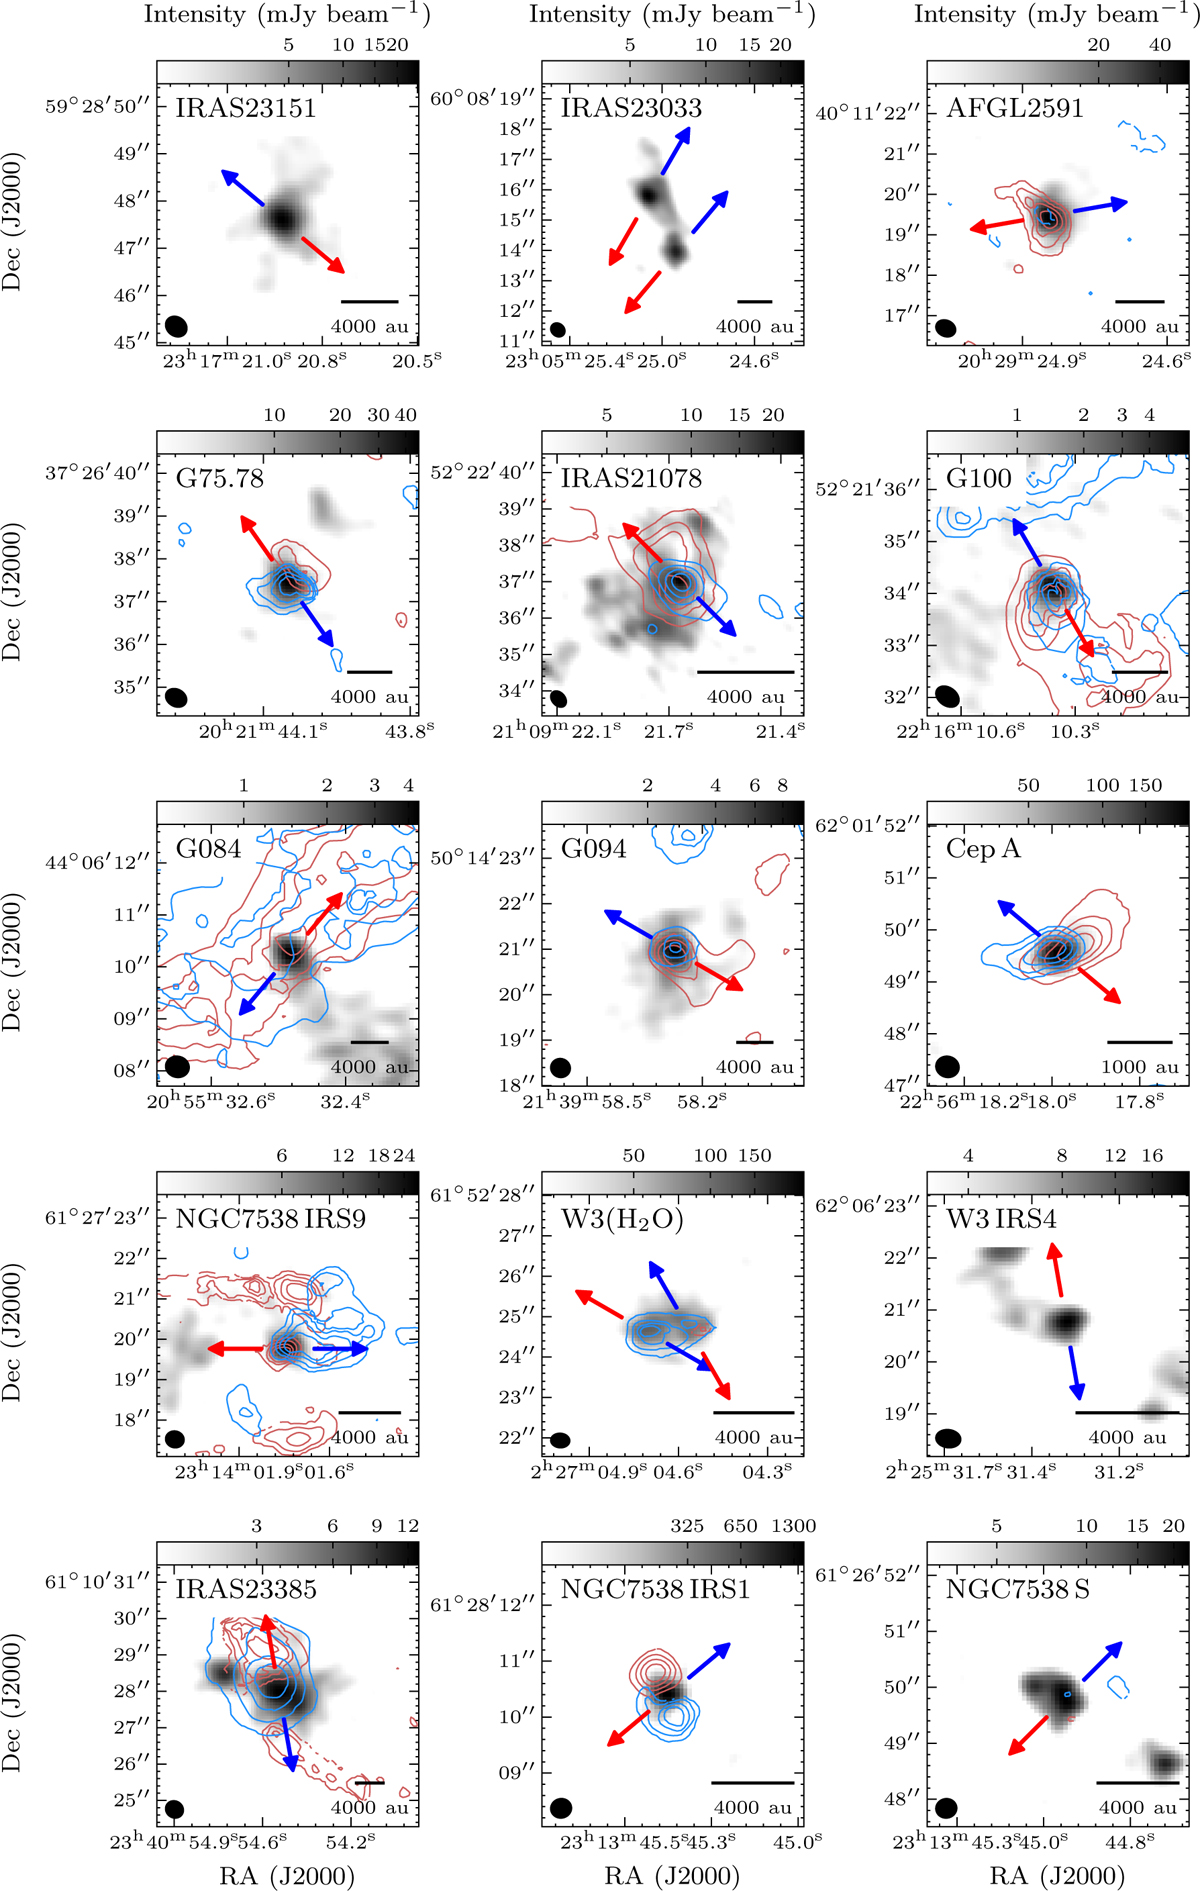
NOEMA 1.37 mm continuum images (greyscale) and intensity maps of 13CO (2 − 1) integrated over the blueshifted and redshifted wings of emission (blue and red contours), tracing either outflows or disk winds. The blue and red arrows correspond to the estimated directions of bipolar blueshifted and redshifted molecular outflows, respectively. A scale-bar is shown in the bottom right corner of each panel. Note that most of the emission is filtered out by the interferometer.
Current usage metrics show cumulative count of Article Views (full-text article views including HTML views, PDF and ePub downloads, according to the available data) and Abstracts Views on Vision4Press platform.
Data correspond to usage on the plateform after 2015. The current usage metrics is available 48-96 hours after online publication and is updated daily on week days.
Initial download of the metrics may take a while.