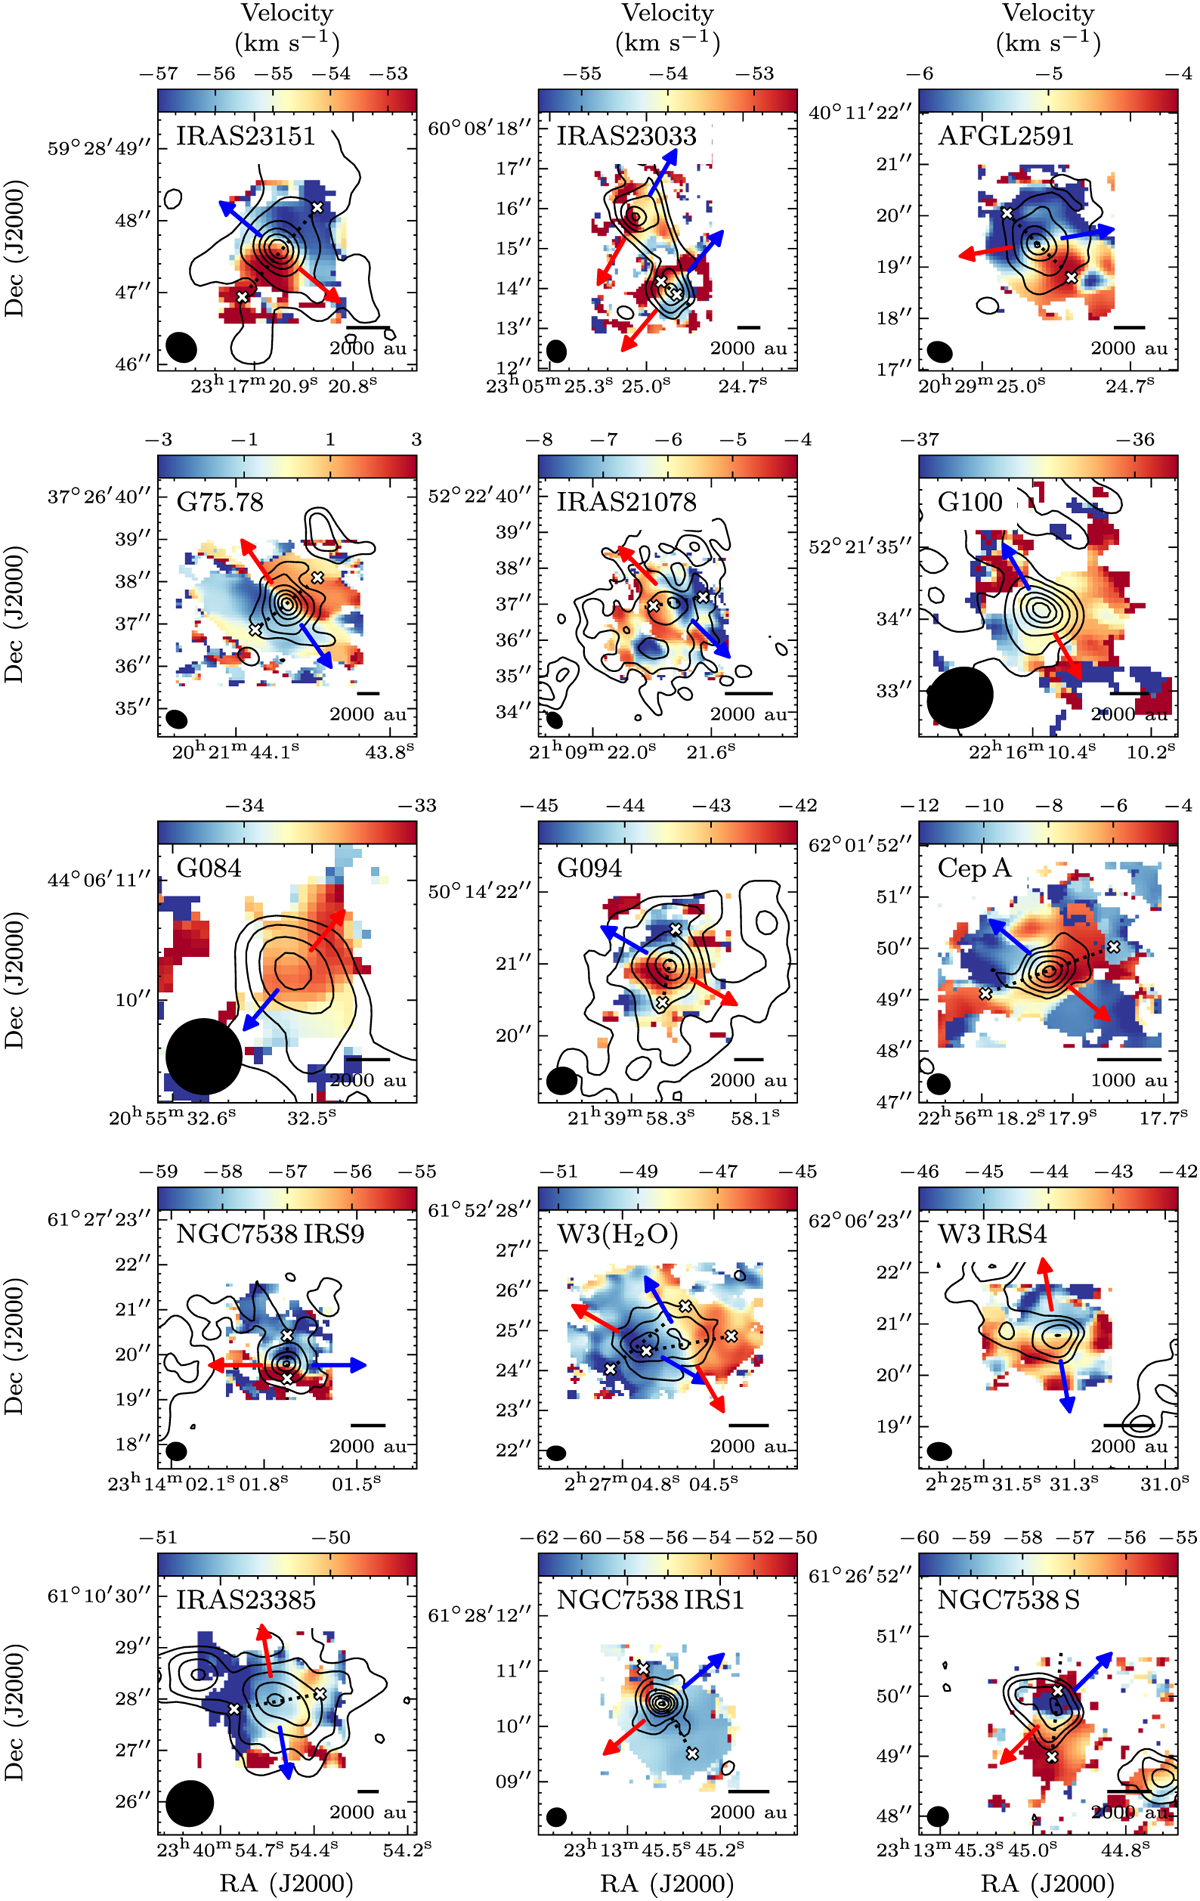
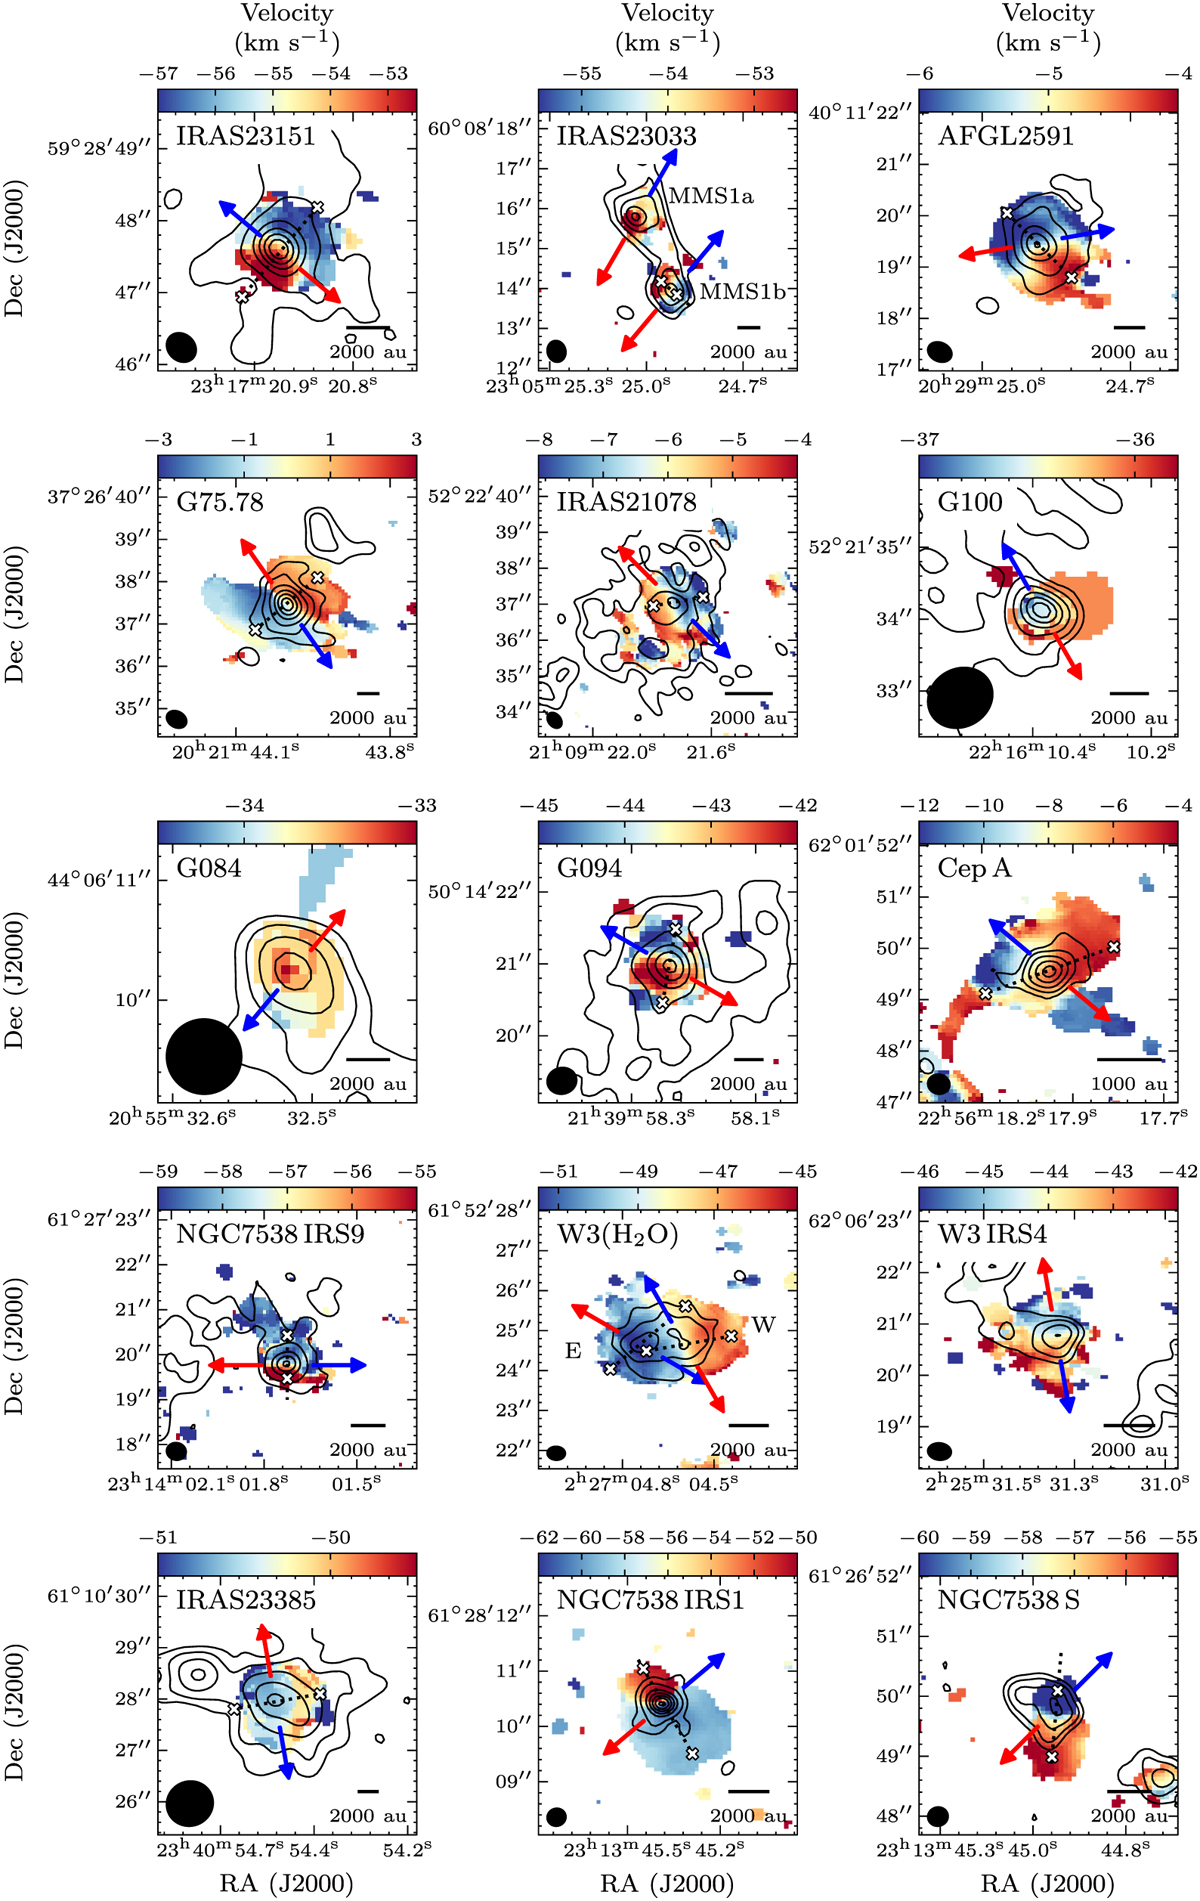
Fig. 2
Download original image Download original image
Intensity-weighted mean velocity (first moment) maps of CH3CN (123−113) showing the dense gas kinematics for 15 of the 20 sources in the CORE survey. The contours correspond to the 1.37 mm continuum as described in Fig. 1. The blue and red arrows correspond to the estimated directions of bipolar blueshifted and redshifted molecular outflows, respectively (see Sect. 4.3). The dotted lines indicate the position of the strongest velocity gradient tracing the disk, i.e. perpendicular to the rotation axis. The edges of the assumed disk extent are marked with an ×. The synthesised beam is shown in the bottom left corner and a scale bar in the bottom right corner of each panel. When displayed in Adobe Acrobat, it is possible to switch to the decomposed velocity map and back to the first moment map for comparison; otherwise, see Fig. B.2.
Current usage metrics show cumulative count of Article Views (full-text article views including HTML views, PDF and ePub downloads, according to the available data) and Abstracts Views on Vision4Press platform.
Data correspond to usage on the plateform after 2015. The current usage metrics is available 48-96 hours after online publication and is updated daily on week days.
Initial download of the metrics may take a while.