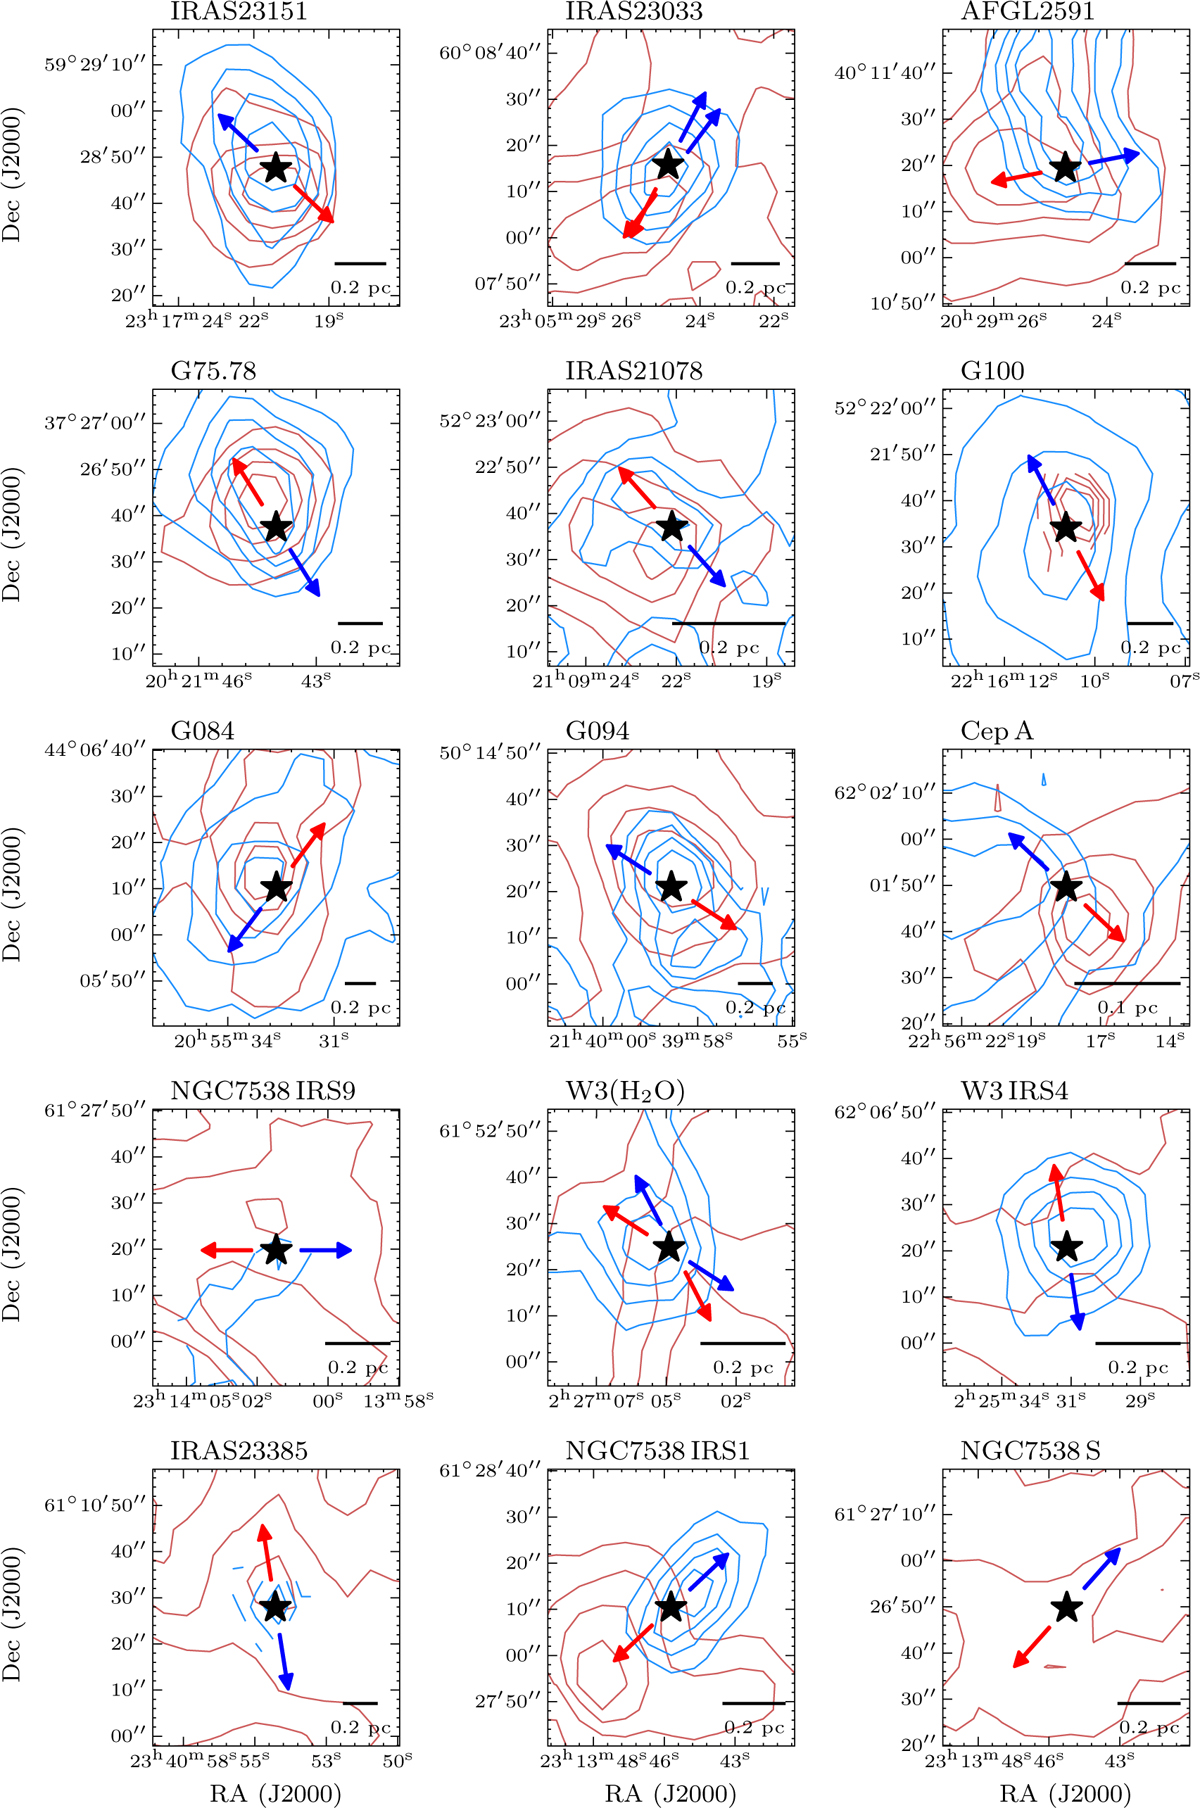
Fig. C.2
Download original image
Intensity maps of 13CO (2 − 1) emission from IRAM 30-m telescope integrated over the blueshifted and redshifted wings of emission, showing the outflow structure. The position of the strongest source in the field is depicted by a star. The blue and red arrows correspond to the estimated directions of bipolar blueshifted and redshifted molecular outflows, respectively. A scale-bar is shown in the bottom right corner of each panel. The map size of the IRAM 30-m observations is 1.5′ by 1.5′ with a half-power beam width of ~11″ at this frequency.
Current usage metrics show cumulative count of Article Views (full-text article views including HTML views, PDF and ePub downloads, according to the available data) and Abstracts Views on Vision4Press platform.
Data correspond to usage on the plateform after 2015. The current usage metrics is available 48-96 hours after online publication and is updated daily on week days.
Initial download of the metrics may take a while.