Fig. 12
Download original image
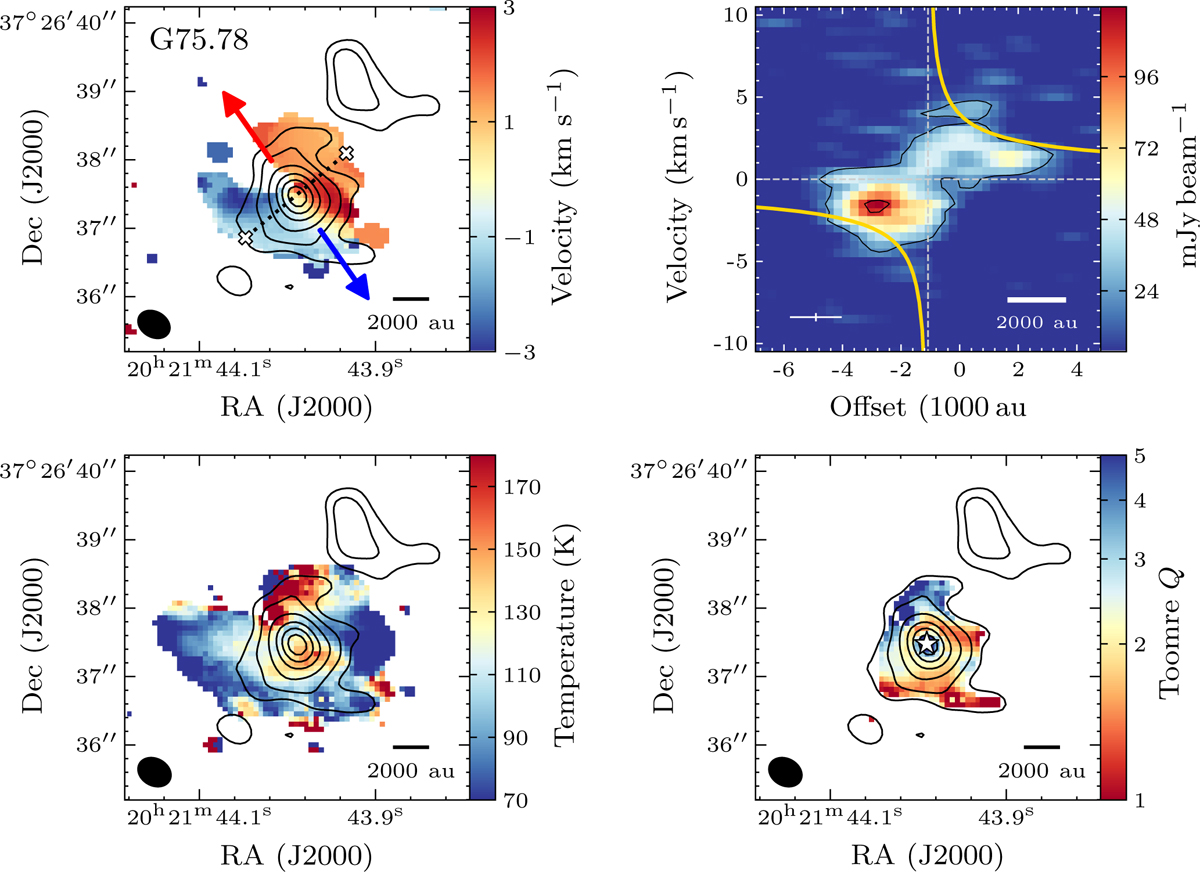
Summary plot showing the kinematics and derived properties for one source in the CORE sample (G75.78). Top left panel: Intensity-weighted mean velocity (first moment) map of CH3CN (125−115) in colour with 1.37 mm continuum contours. The blue and red arrows correspond to the estimated directions of bipolar blueshifted and redshifted molecular outflows, respectively. The dotted line indicates the position of the strongest velocity gradient tracing the disk, i.e. perpendicular to the rotation axis. The edges of the assumed disk extent are marked with an ×. Top right panel: PV plot of CH3CN (125−115) along the cut in the direction of rotation as depicted by the dotted line in the top left panel. The contours correspond to the 6σ level increasing in steps of 24σ. Yellow lines show the Keplerian rotation curves for an enclosed mass of 19 M⊙. The cross in the bottom right corner corresponds to the spatial and spectral resolutions. Bottom left panel: Rotational temperature maps obtained by fitting CH3CN(12K−11K) K = 0–6 and CH313CN(12K−11K) K = 0–3 lines with XCLASS in colour and 1.37 mm continuum contours. Bottom right panel: Toomre Q map assuming a protostar is located at the position of the continuum peak as depicted by a star and accounting for the self-gravity of the disk, with 1.37 mm continuum contours. Regions outside of 6σ continuum contours are masked out. The synthesised beam and a scale bar are shown in the bottom of the panels.
Current usage metrics show cumulative count of Article Views (full-text article views including HTML views, PDF and ePub downloads, according to the available data) and Abstracts Views on Vision4Press platform.
Data correspond to usage on the plateform after 2015. The current usage metrics is available 48-96 hours after online publication and is updated daily on week days.
Initial download of the metrics may take a while.