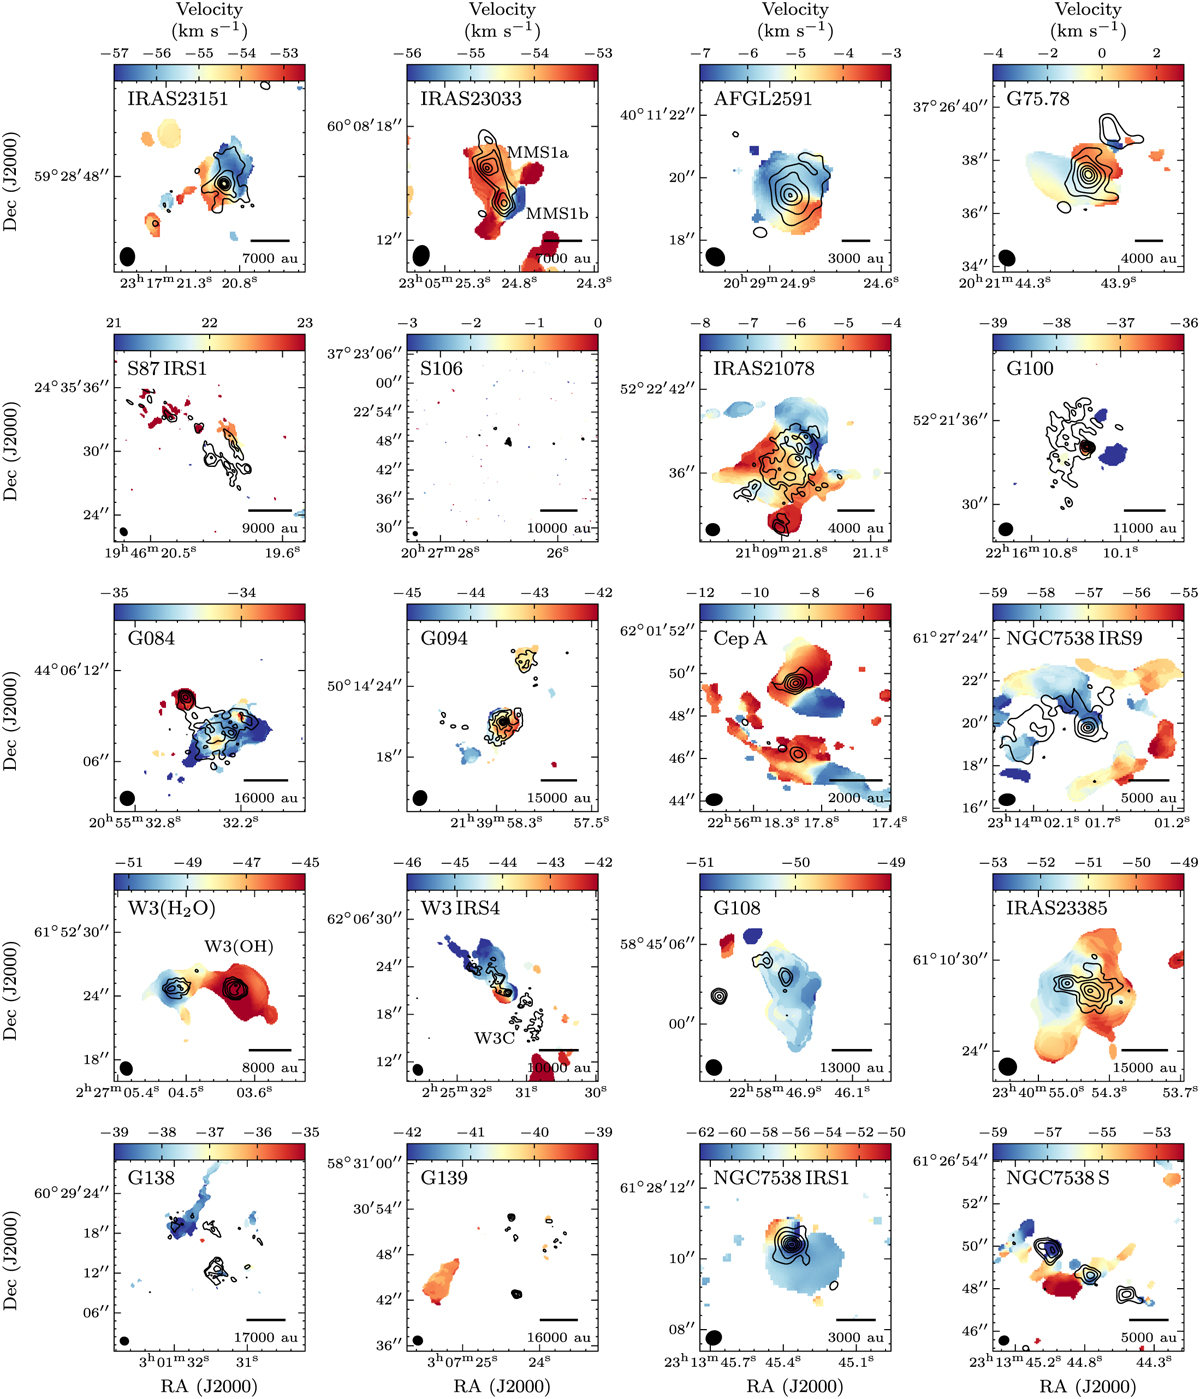
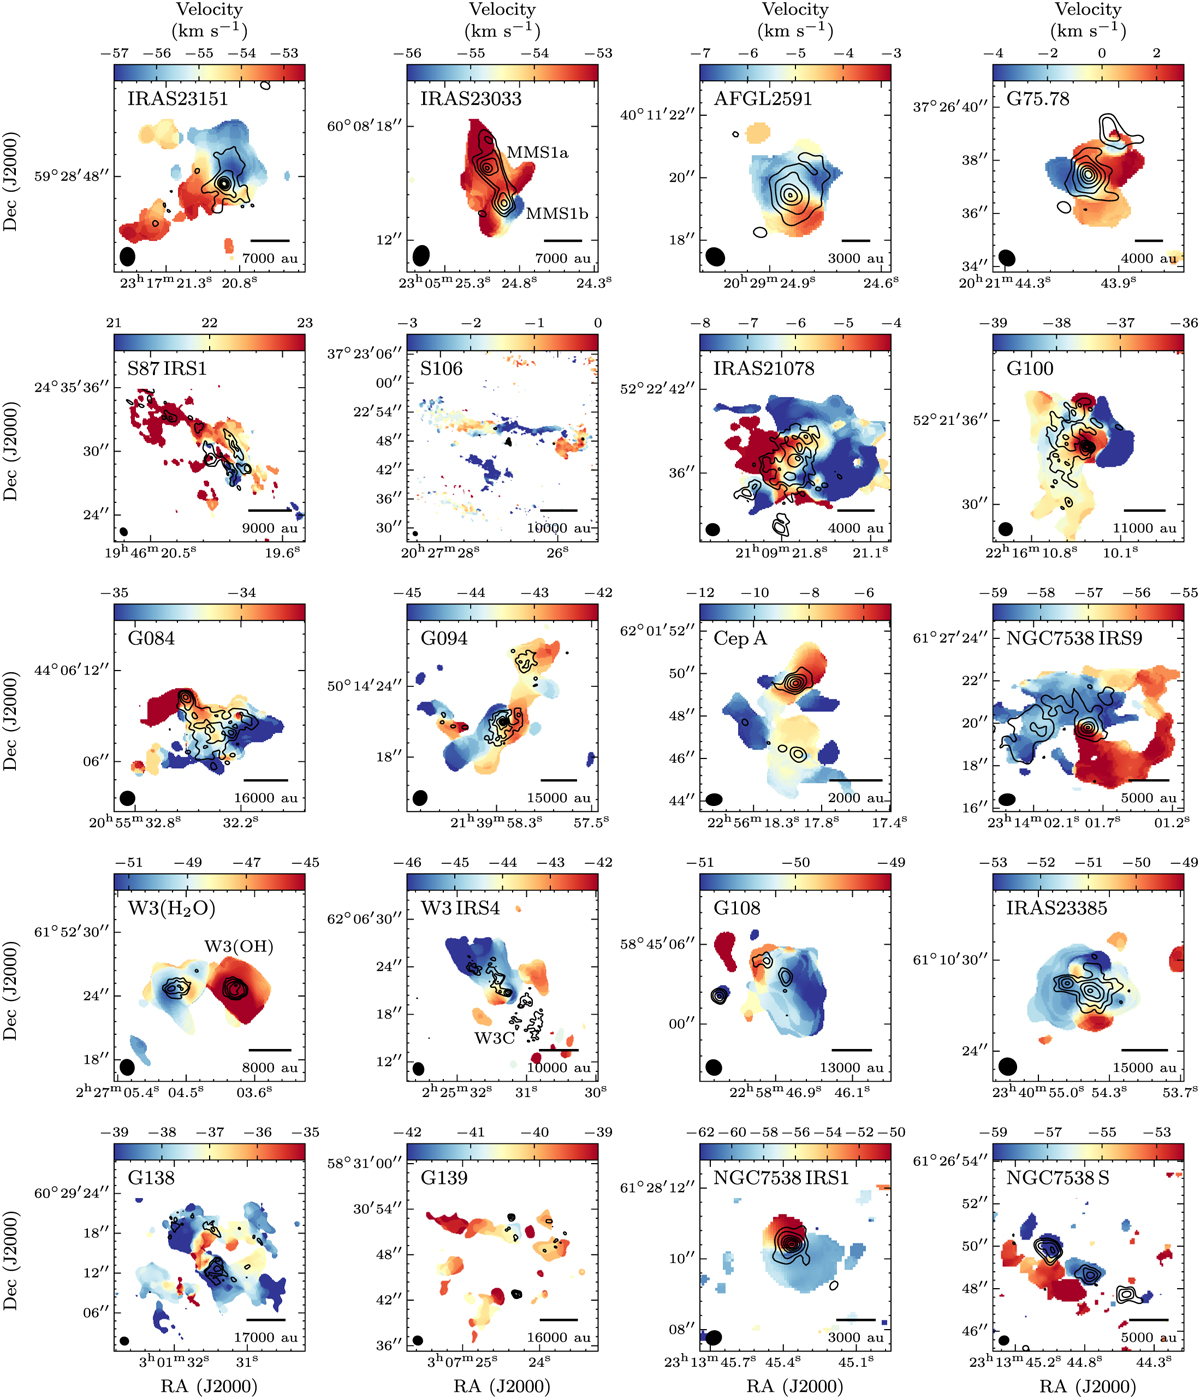
Fig. 1
Download original image Download original image
Intensity-weighted mean velocity (first moment) maps of H2CO (30,3 − 20,2) showing the large-scale kinematics of the full CORE sample. The contours correspond to the continuum maps imaged with uniform weighting as presented in Beuther et al. (2018). The outermost three contours correspond to 5, 10, and 20σ levels, then increasing in steps of 15σ. For IRAS 23151, NGC753 8IRS1, NGC753 8IRS9 and AFGL2591 the outermost three contours correspond to 5, 15, and 40σ levels, then increasing in steps of 25σ (see Table 3 for σ values). The synthesised beam is shown in the bottom left corner and a scale bar in the bottom right corner of each panel. When displayed in Adobe Acrobat, it is possible to switch to the first moment map of CH3OH(4 − 3) and back to the first moment map of H2CO(30,3 − 20,2) for comparison.
Current usage metrics show cumulative count of Article Views (full-text article views including HTML views, PDF and ePub downloads, according to the available data) and Abstracts Views on Vision4Press platform.
Data correspond to usage on the plateform after 2015. The current usage metrics is available 48-96 hours after online publication and is updated daily on week days.
Initial download of the metrics may take a while.