Open Access
Fig. 6
Download original image
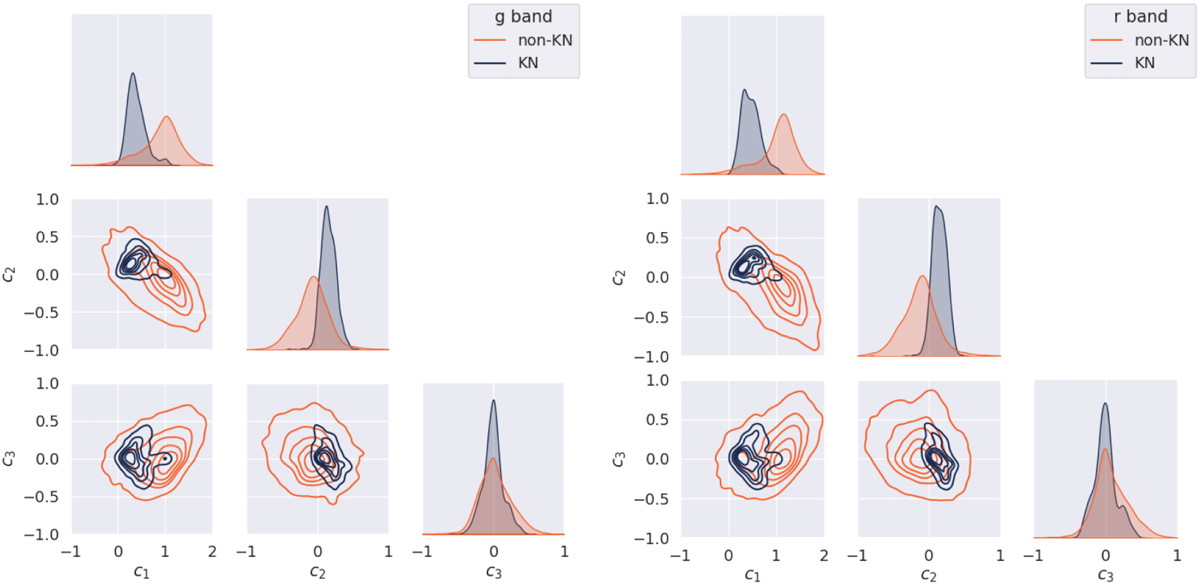
Distribution of ℱtest (Sect. 3.3) events in the features space. Orange contours denote non-KN and blue contours mark KN events. The panels show distributions in different filters for c1,c2, and c3 (coefficient associated with basis vectors p1,p2, and p3, respectively).
Current usage metrics show cumulative count of Article Views (full-text article views including HTML views, PDF and ePub downloads, according to the available data) and Abstracts Views on Vision4Press platform.
Data correspond to usage on the plateform after 2015. The current usage metrics is available 48-96 hours after online publication and is updated daily on week days.
Initial download of the metrics may take a while.