Fig. 4
Download original image
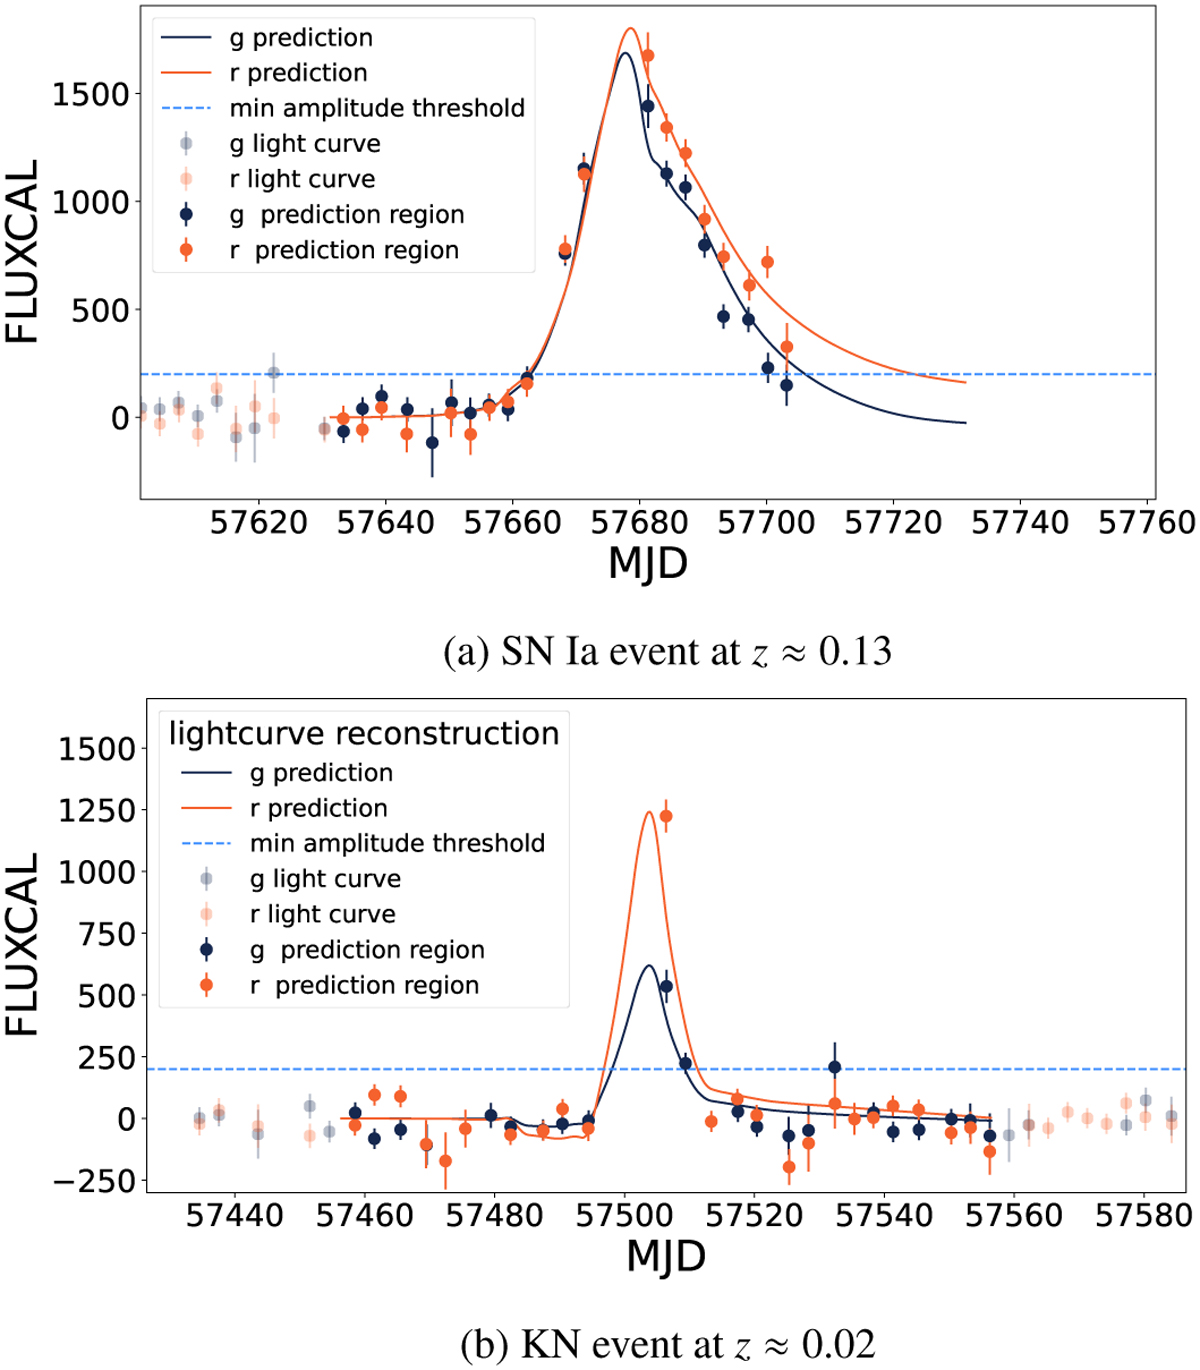
Light curves from the ztf_sims dataset. Points correspond to measurements from SN la (top) and kilonova (KN, bottom) events, observed in the two ZTF filters. Dark points mark the measurements used for feature extraction, while transparent ones lie outside the prediction region (±50 days since maximum). Full lines show the reconstructed light curve and the dotted horizontal light blue line marks the minimum flux threshold.
Current usage metrics show cumulative count of Article Views (full-text article views including HTML views, PDF and ePub downloads, according to the available data) and Abstracts Views on Vision4Press platform.
Data correspond to usage on the plateform after 2015. The current usage metrics is available 48-96 hours after online publication and is updated daily on week days.
Initial download of the metrics may take a while.