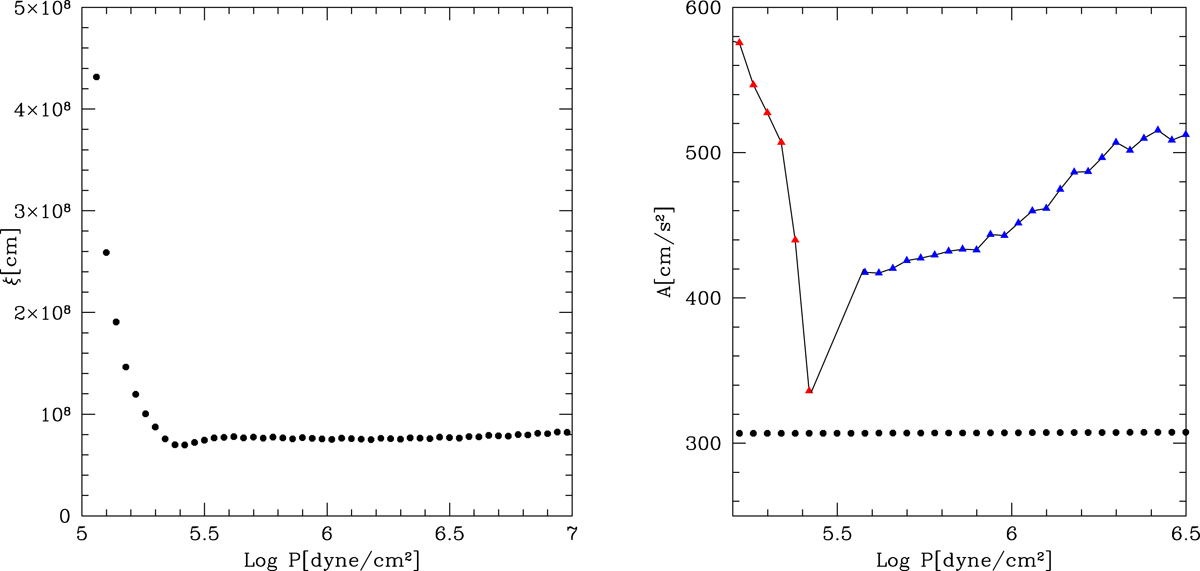
Fig. 9.
Download original image
Profiles of dimensions and acceleration of convective elements across the most external convective region of a low mass star. Left panel: dimension reached by the convective elements at tasy as a function of log P. Since tasy decreases, the velocity and dimensions of the convective elements in these very external layers are also expected to decrease going toward the adiabatic fall layer. Right panel: radial acceleration of a convective element as a function of the depth (log P) across the external convective zone of the stellar models representing the Sun (thin solid lines with triangles). With respect to the layer of the adiabatic fall (at log P = 5.4 dyn cm−2), the left branch of the curve (red triangles) is for ξe > D, i.e., Eq. (51), whereas the right branch (blue triangles) is for ξe < D, i.e., Eq. (52), and the minimum of the acceleration “coincides” with the value of ≃300 cm s−2 given by the SFCT, see Eq. (50). The horizontal dotted line is the nearly constant acceleration from the MLT.
Current usage metrics show cumulative count of Article Views (full-text article views including HTML views, PDF and ePub downloads, according to the available data) and Abstracts Views on Vision4Press platform.
Data correspond to usage on the plateform after 2015. The current usage metrics is available 48-96 hours after online publication and is updated daily on week days.
Initial download of the metrics may take a while.