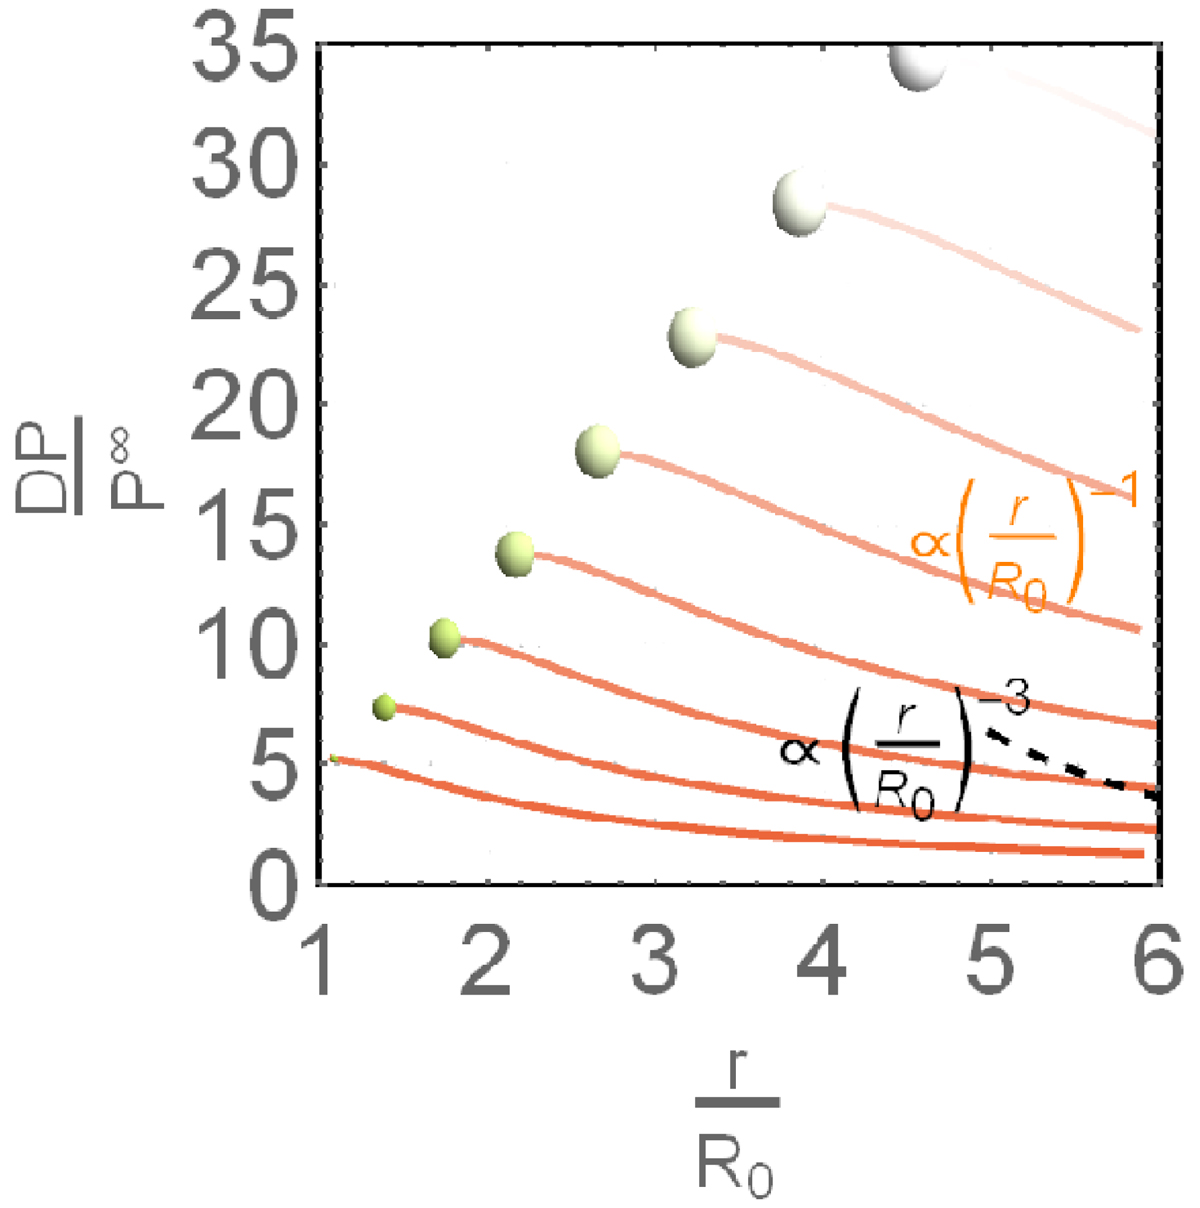
Fig. 3.
Download original image
Temporal and spatial evolution of relative pressure ratio between the value at the surface of a convective element and the one at infinity. Time runs from τ = 0 to τ = 2 from the bottom to the top. The lines start at the surface of a generic spherical element whose position and dimensions grow with time. The radius increases according to Eq. (40). The curves starting from the surface of the different spheres show the variation of the relative pressure difference moving far away from the surface of the element to large distances. The lines refer to the case of a fluid in the irrotational potential-flow approximation. The dashed line shows (limited to one case) the expected variation for a rotational flow. The disintegration of any generic convective element as time goes on is mimicked here by drawing the spheres and lines with progressively less intense colors. Data are taken from Pasetto et al. (2019).
Current usage metrics show cumulative count of Article Views (full-text article views including HTML views, PDF and ePub downloads, according to the available data) and Abstracts Views on Vision4Press platform.
Data correspond to usage on the plateform after 2015. The current usage metrics is available 48-96 hours after online publication and is updated daily on week days.
Initial download of the metrics may take a while.