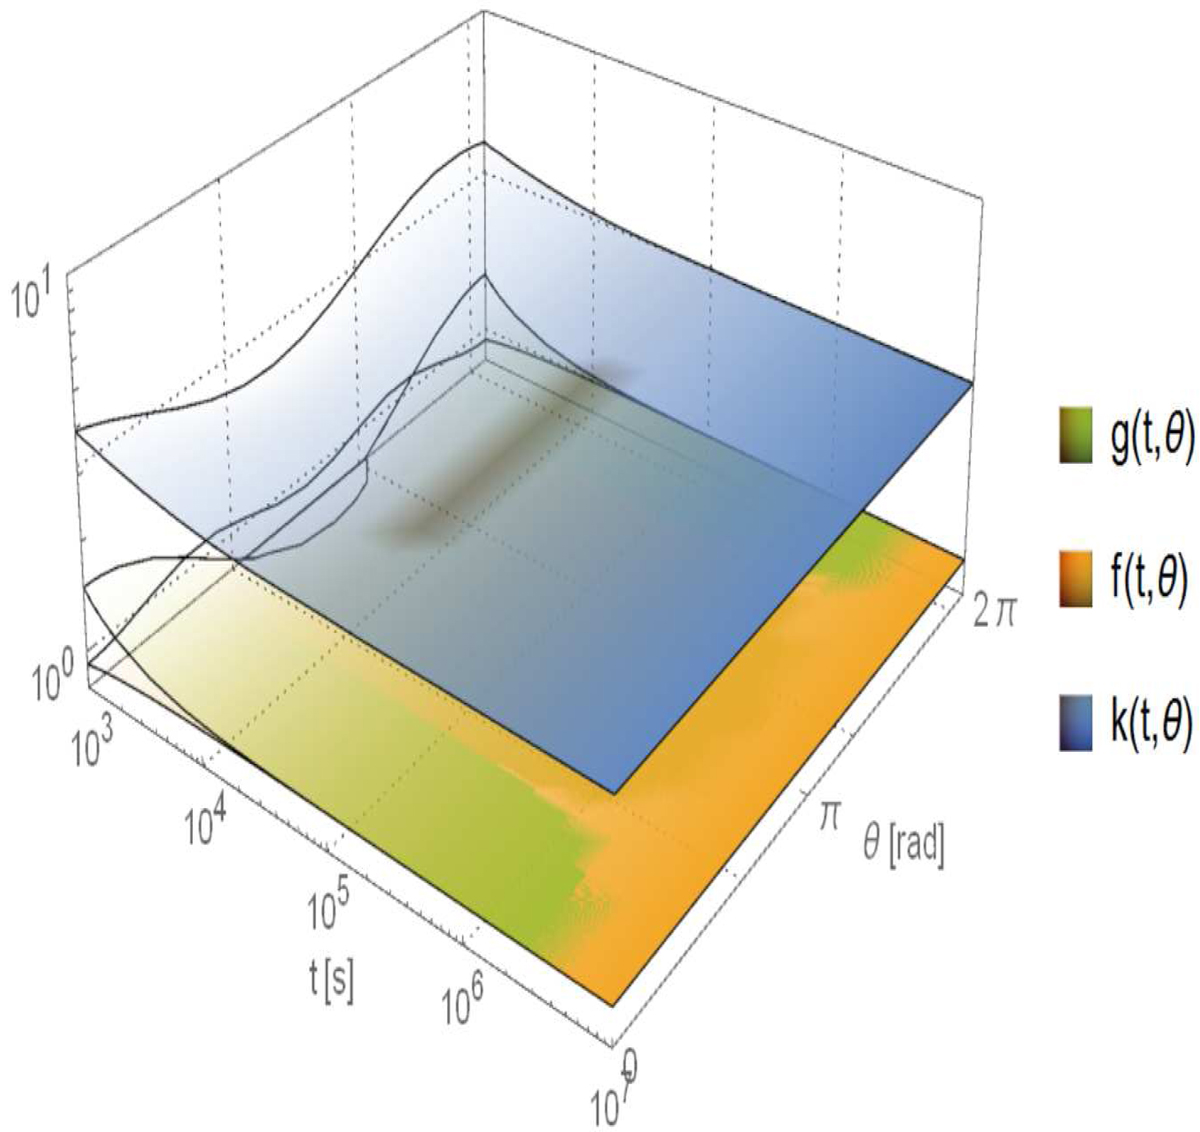
Fig. 14.
Download original image
Numerical validation of Lemma 1 in Pasetto et al. (2014). The functions g,f, and k are defined in the text and plotted against the values of interest in the Lemma 1, i.e., in the “asymptotic” regime of validity of the uniqueness theorem. Evidently, the blue manifold always remains above the green and yellow ones for all the timescales of interest and for any angular dependence of the equations. This temporal interval covers all the stars calculated by Pasetto et al. (2016). Data are from Pasetto et al. (2019).
Current usage metrics show cumulative count of Article Views (full-text article views including HTML views, PDF and ePub downloads, according to the available data) and Abstracts Views on Vision4Press platform.
Data correspond to usage on the plateform after 2015. The current usage metrics is available 48-96 hours after online publication and is updated daily on week days.
Initial download of the metrics may take a while.