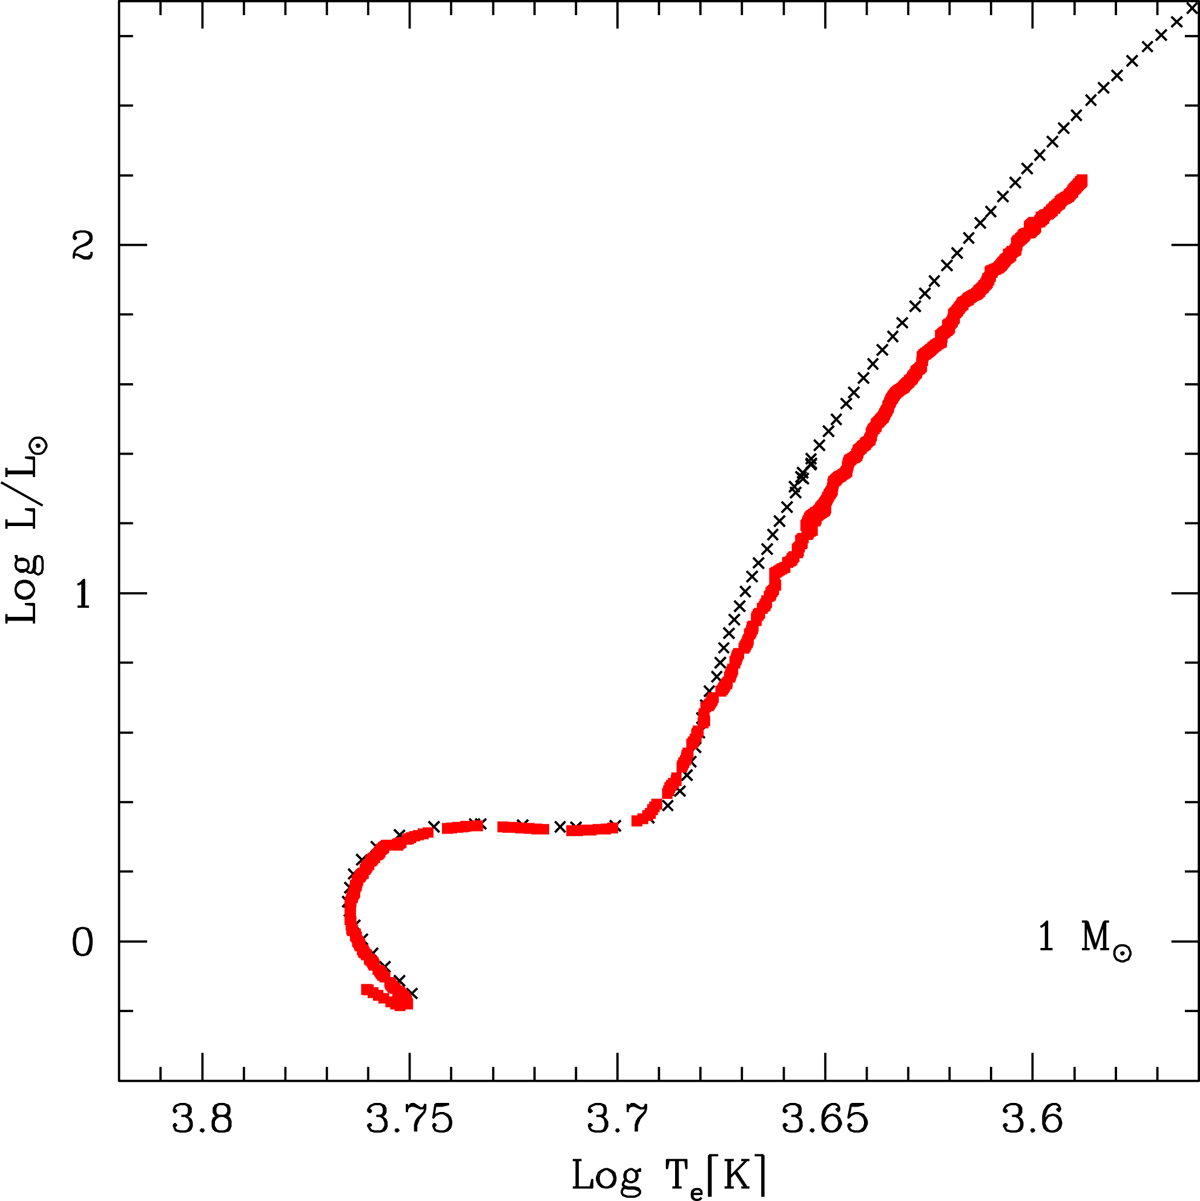
Fig. 12.
Download original image
Evolutionary tracks of 1.0 M⊙ star with chemical composition [X = 0.703, Y = 0.280, Z = 0.017] calculated with the SFCT and the new boundary conditions (red dots) and the old boundary conditions (blue squares) and the MLT with Λm = 1.68 (black crosses). The SFCT models with the old and new boundary conditions fully overlap each other. No significant difference is found among the three cases from the main sequence up to the bottom of the RGB. As already noticed by Pasetto et al. (2016), the RGB with the SFCT is more inclined compared to the correspondent one obtained from the MLT (see the text for more details on this issue).
Current usage metrics show cumulative count of Article Views (full-text article views including HTML views, PDF and ePub downloads, according to the available data) and Abstracts Views on Vision4Press platform.
Data correspond to usage on the plateform after 2015. The current usage metrics is available 48-96 hours after online publication and is updated daily on week days.
Initial download of the metrics may take a while.