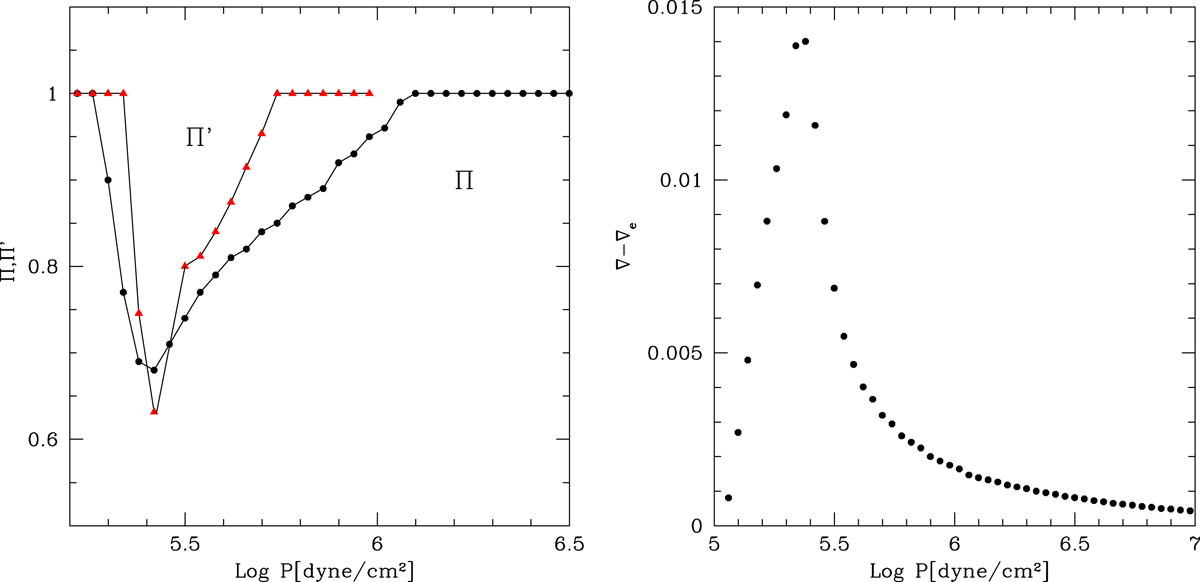
Fig. 10.
Download original image
Profiles of Π, Π′, and difference ∇ − ∇e across the most external convective regions of a low-mass star. Left panel: ratios Π and Π′ are compared and found in good qualitative agreement. Right panel: difference ∇ − ∇e as a function of position (log P). The maximum difference between the two gradients occurs at the layer of the adiabatic fall.
Current usage metrics show cumulative count of Article Views (full-text article views including HTML views, PDF and ePub downloads, according to the available data) and Abstracts Views on Vision4Press platform.
Data correspond to usage on the plateform after 2015. The current usage metrics is available 48-96 hours after online publication and is updated daily on week days.
Initial download of the metrics may take a while.