Fig. 9
Download original image
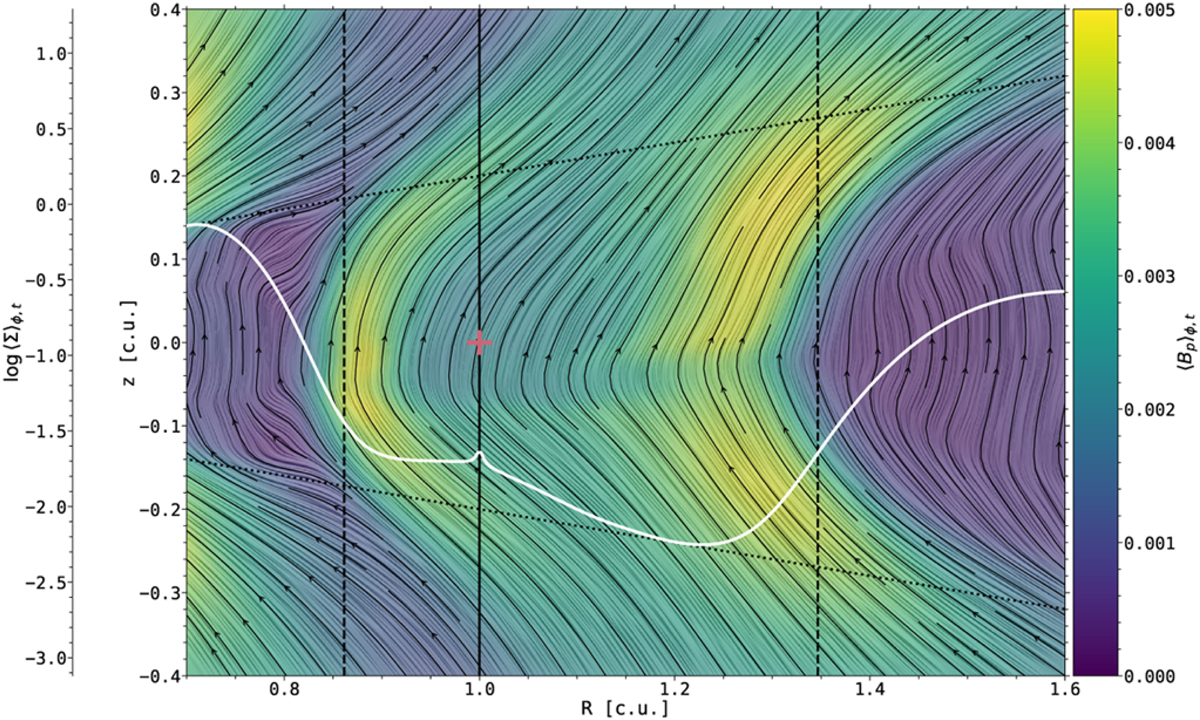
Poloidal magnetic field in the gap for the run Mj-β3, averaged in azimuth and over the last 100 orbits (episode ℰ2). The background color represents the logarithm of the poloidal magnetic field. The black streamlines and the LIC correspond to the radial and vertical components of the poloidal magnetic field. The white curves represents the radial profile of log(Σ), also averaged in azimuth and over the last 100 orbits. The red cross and solid black line pinpoint the location of the planet. Vertical black dashed lines delineate the gap edges at R ≃ Rp − 2Rhill and R ≃ Rp + 5Rhill. The upper and lower surfaces ±zw ≃ ±4H(R) are indicated by the black dotted lines.
Current usage metrics show cumulative count of Article Views (full-text article views including HTML views, PDF and ePub downloads, according to the available data) and Abstracts Views on Vision4Press platform.
Data correspond to usage on the plateform after 2015. The current usage metrics is available 48-96 hours after online publication and is updated daily on week days.
Initial download of the metrics may take a while.