Fig. 4
Download original image
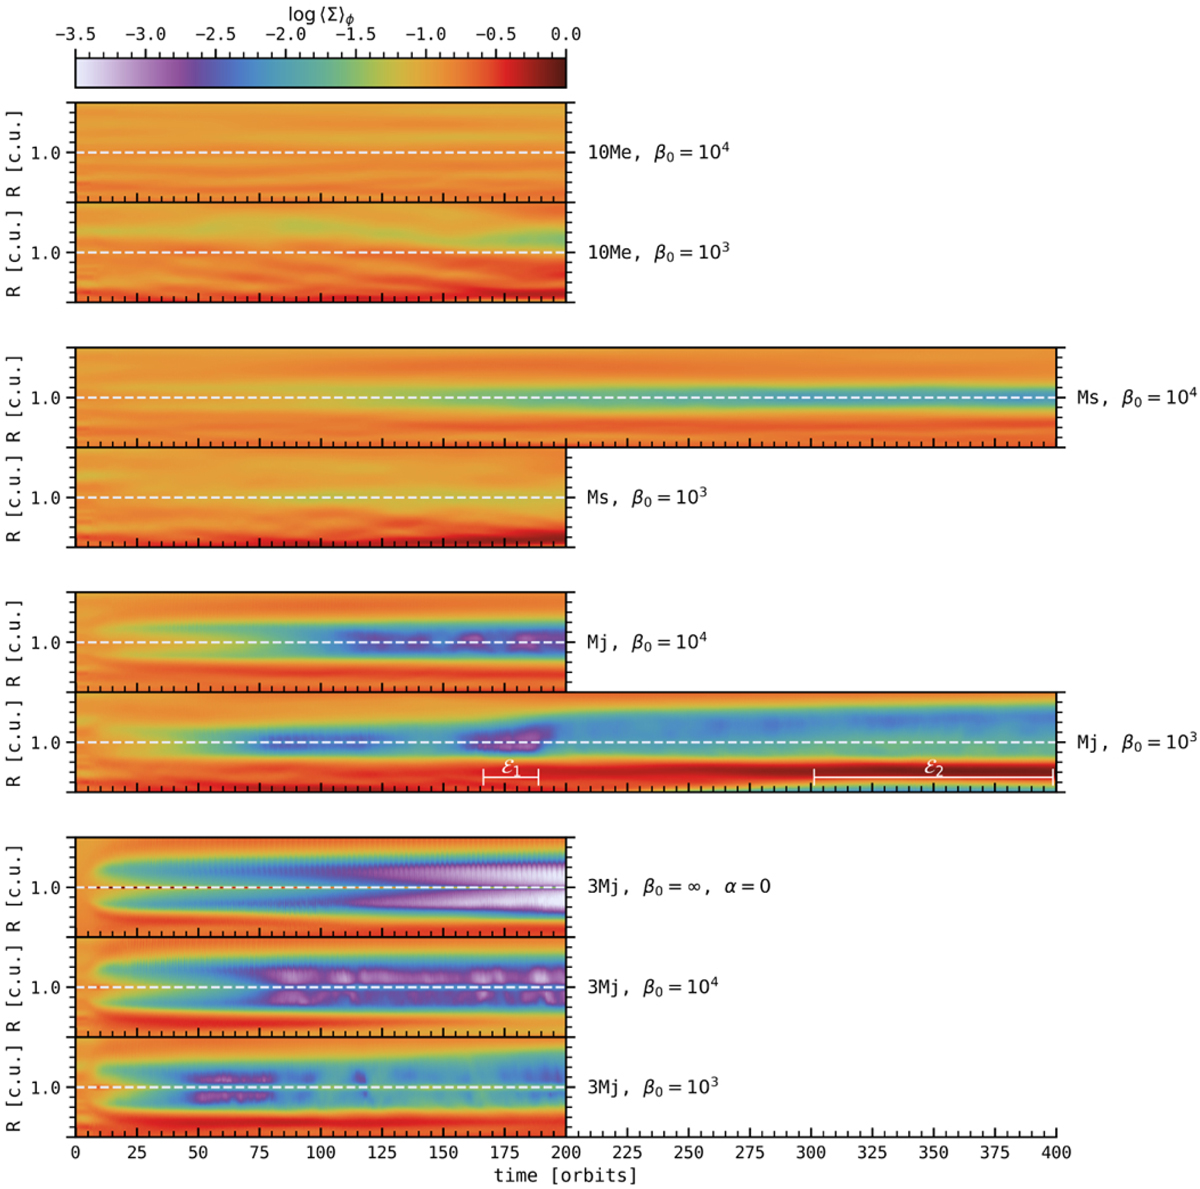
Space-time diagrams showing the evolution of the logarithm of the gas surface density Σ for the nine runs divided in four groups of different planet masses. The top plot of each group has the lowest magnetization, whereas the bottom plot has the highest. The radial extent of all the diagrams range from 0.5 to 1.5 code units, with the planet at R = 1. We pinpoint as ℰ1 and ℰ2 two episodes in the run Mj-β3 that will be discussed in Sect. 3.2.3.
Current usage metrics show cumulative count of Article Views (full-text article views including HTML views, PDF and ePub downloads, according to the available data) and Abstracts Views on Vision4Press platform.
Data correspond to usage on the plateform after 2015. The current usage metrics is available 48-96 hours after online publication and is updated daily on week days.
Initial download of the metrics may take a while.