Fig. B.4
Download original image
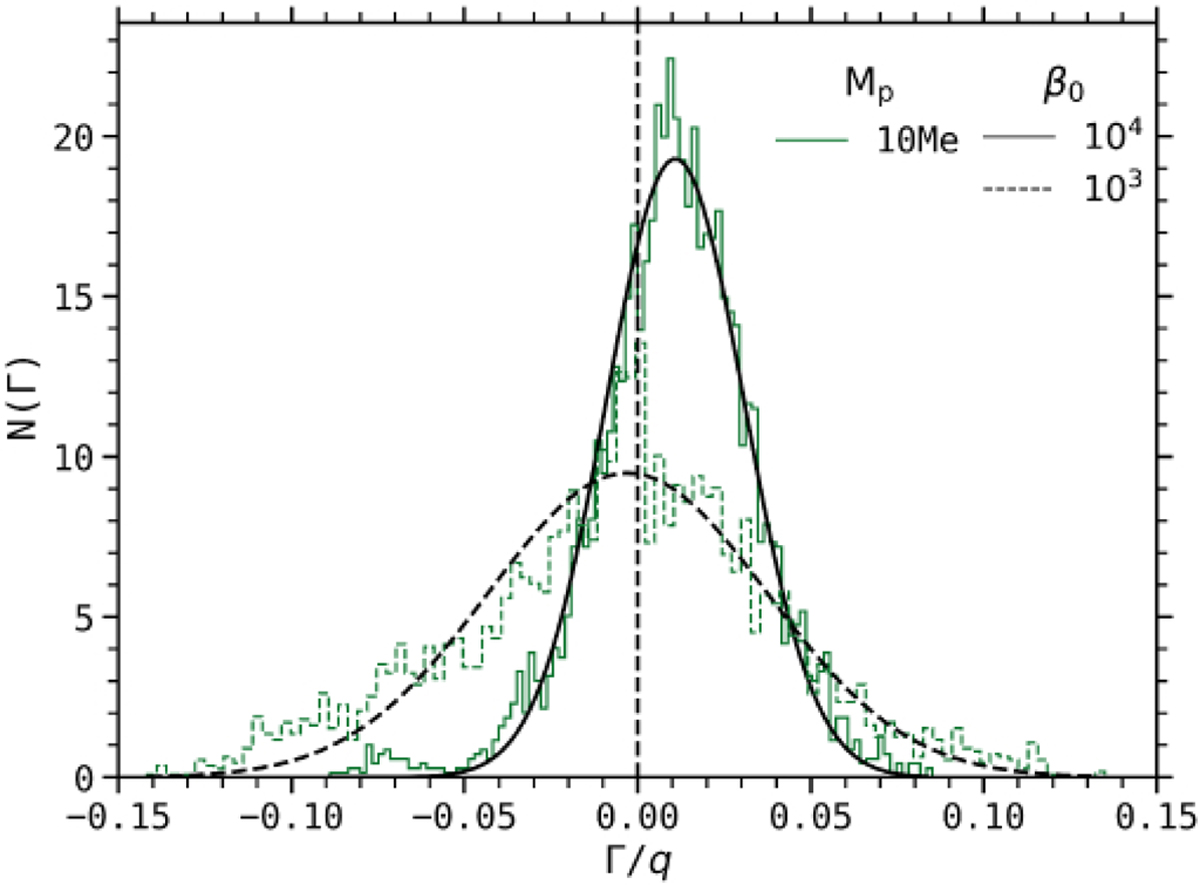
Frequency distribution of the torques exerted on the least massive planets plotted in green in Figure 14, e.g., for the runs 10Me-β3 and 10Me-β4. These two histograms show the stochasticity of the torques experienced by the 10 Earth mass planets, via a Gaussian distribution with standard deviation of σ3 ≃ 4 × 10⁻² and σ4 ≃ 2 × 10⁻² for an initial β0 of 103 and 104 respectively.
Current usage metrics show cumulative count of Article Views (full-text article views including HTML views, PDF and ePub downloads, according to the available data) and Abstracts Views on Vision4Press platform.
Data correspond to usage on the plateform after 2015. The current usage metrics is available 48-96 hours after online publication and is updated daily on week days.
Initial download of the metrics may take a while.