Fig. B.1

Download original image
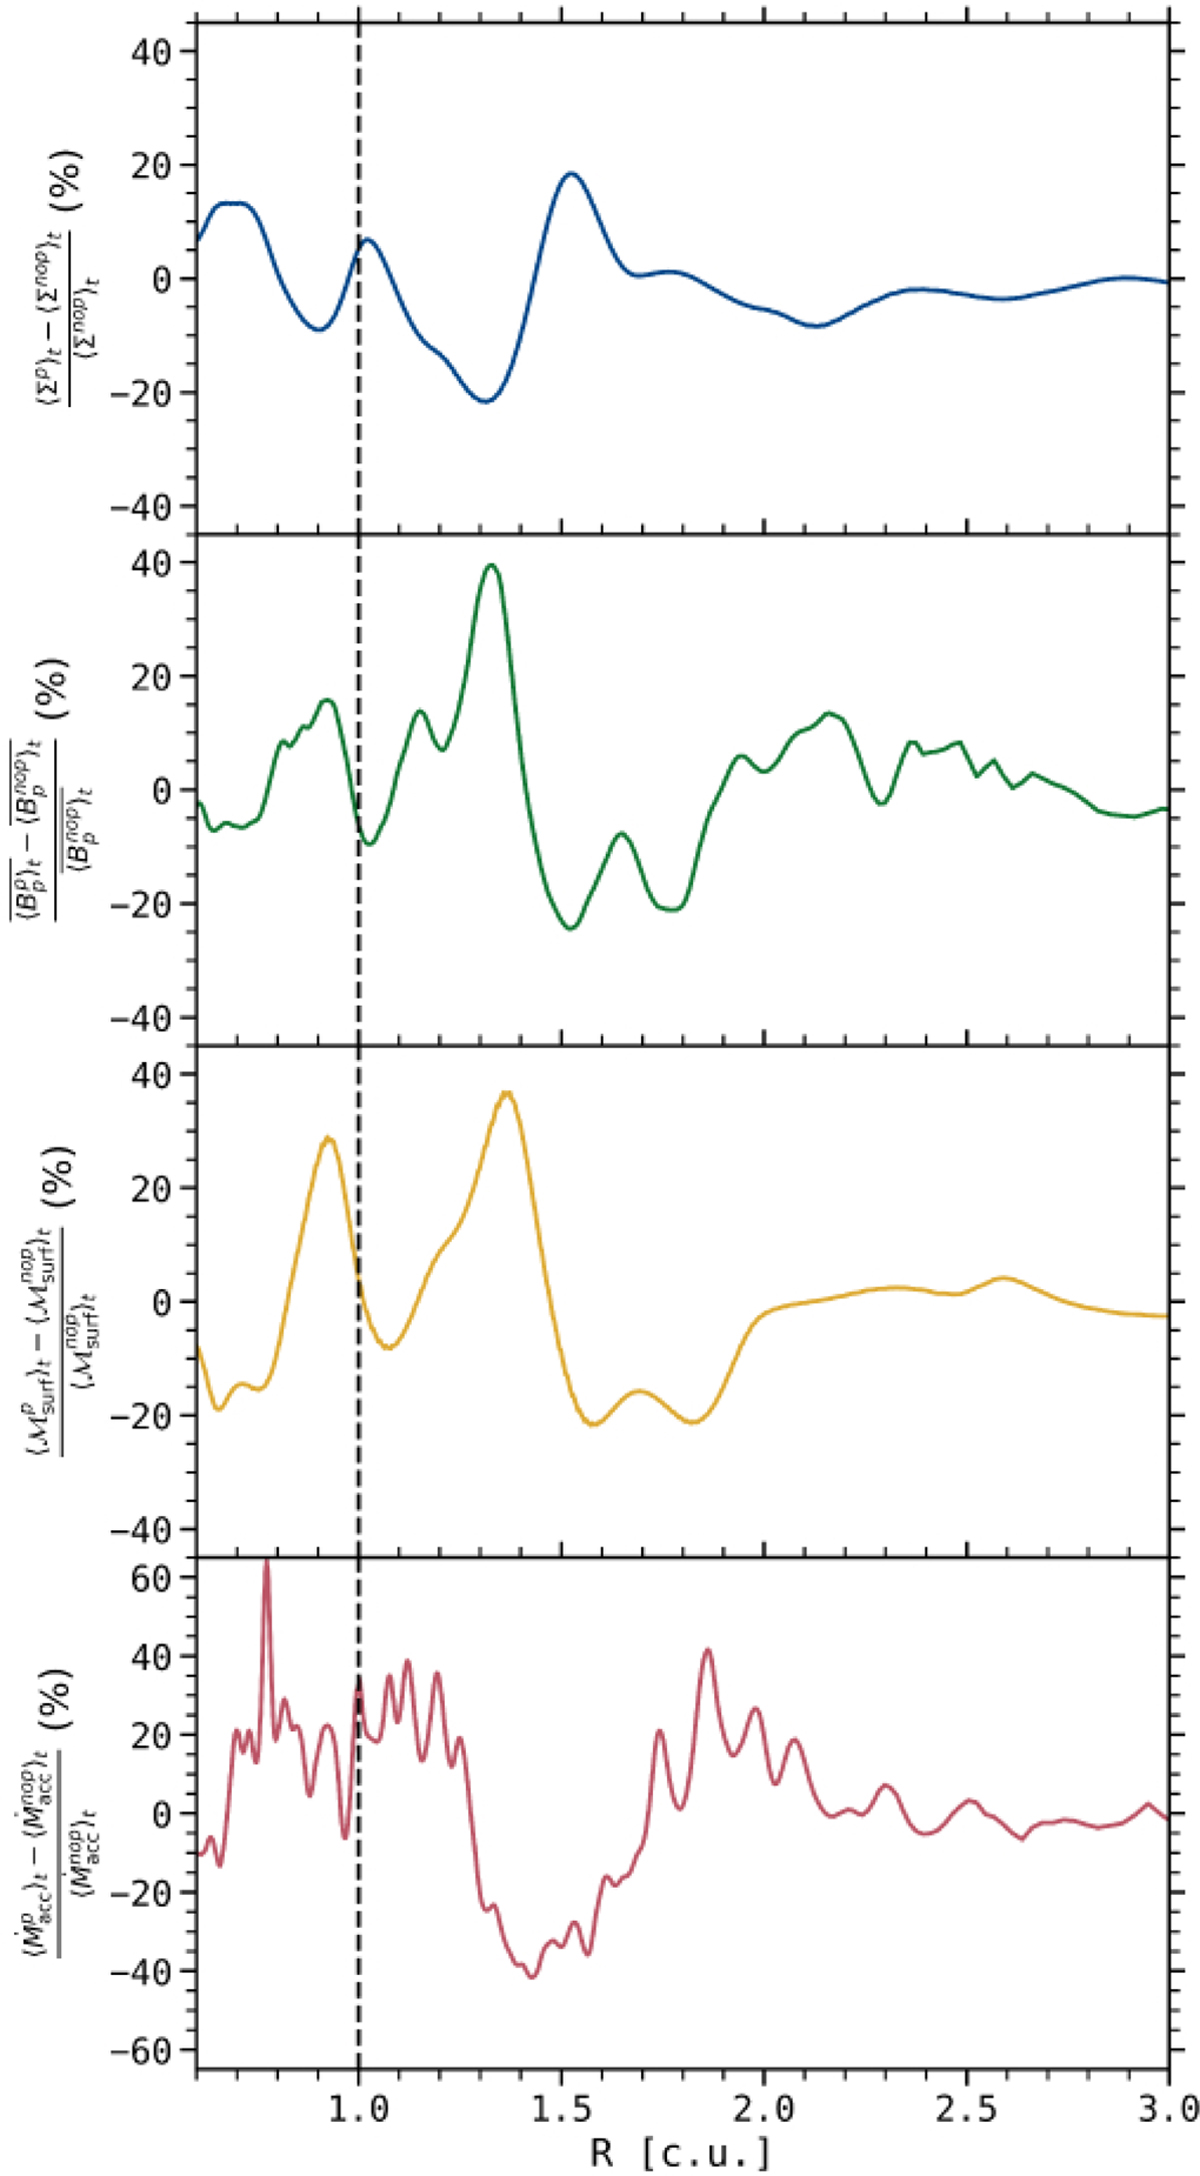
Radial profiles of different quantities averaged between 50 and 100 orbits, compared in percent between a disk model without and with a 10 Earth mass planet: gas surface density Σ in blue (first panel), amplitude of the poloidal magnetic field Bp in green (second panel), wind torque at the disk surface ℳsurf in yellow (third panel), radial mass flux Ṁacc in red (fourth panel). The location of the planet is indicated by the vertical black dashed line. Note that such disk model evolves dynamically, and the structures that are created at a given time will evolve radially and in amplitude, making the comparison difficult.
Current usage metrics show cumulative count of Article Views (full-text article views including HTML views, PDF and ePub downloads, according to the available data) and Abstracts Views on Vision4Press platform.
Data correspond to usage on the plateform after 2015. The current usage metrics is available 48-96 hours after online publication and is updated daily on week days.
Initial download of the metrics may take a while.


