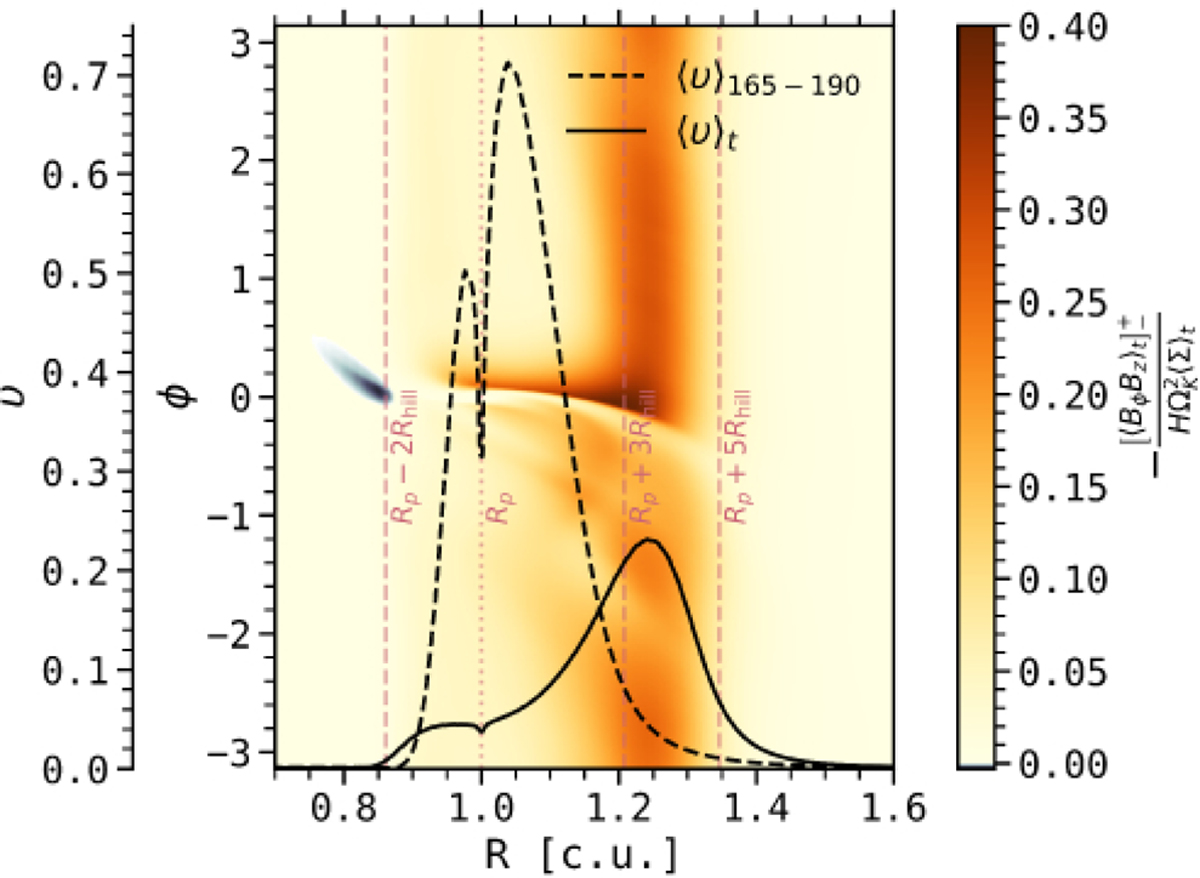
Fig. 13
Download original image
2D map of υ, i.e., the magnetic torque per unit of surface density, at the disk surface in (R-ϕ) coordinates, averaged over the episode ℰ2 in the run Mj-β3. We highlight in dark blue the region where the magnetic torque is negative, which corresponds here to a slight deposition of angular momentum. The solid and dashed black lines show respectively υ during ℰ2 and ℰ1.
Current usage metrics show cumulative count of Article Views (full-text article views including HTML views, PDF and ePub downloads, according to the available data) and Abstracts Views on Vision4Press platform.
Data correspond to usage on the plateform after 2015. The current usage metrics is available 48-96 hours after online publication and is updated daily on week days.
Initial download of the metrics may take a while.