Fig. 8.
Download original image
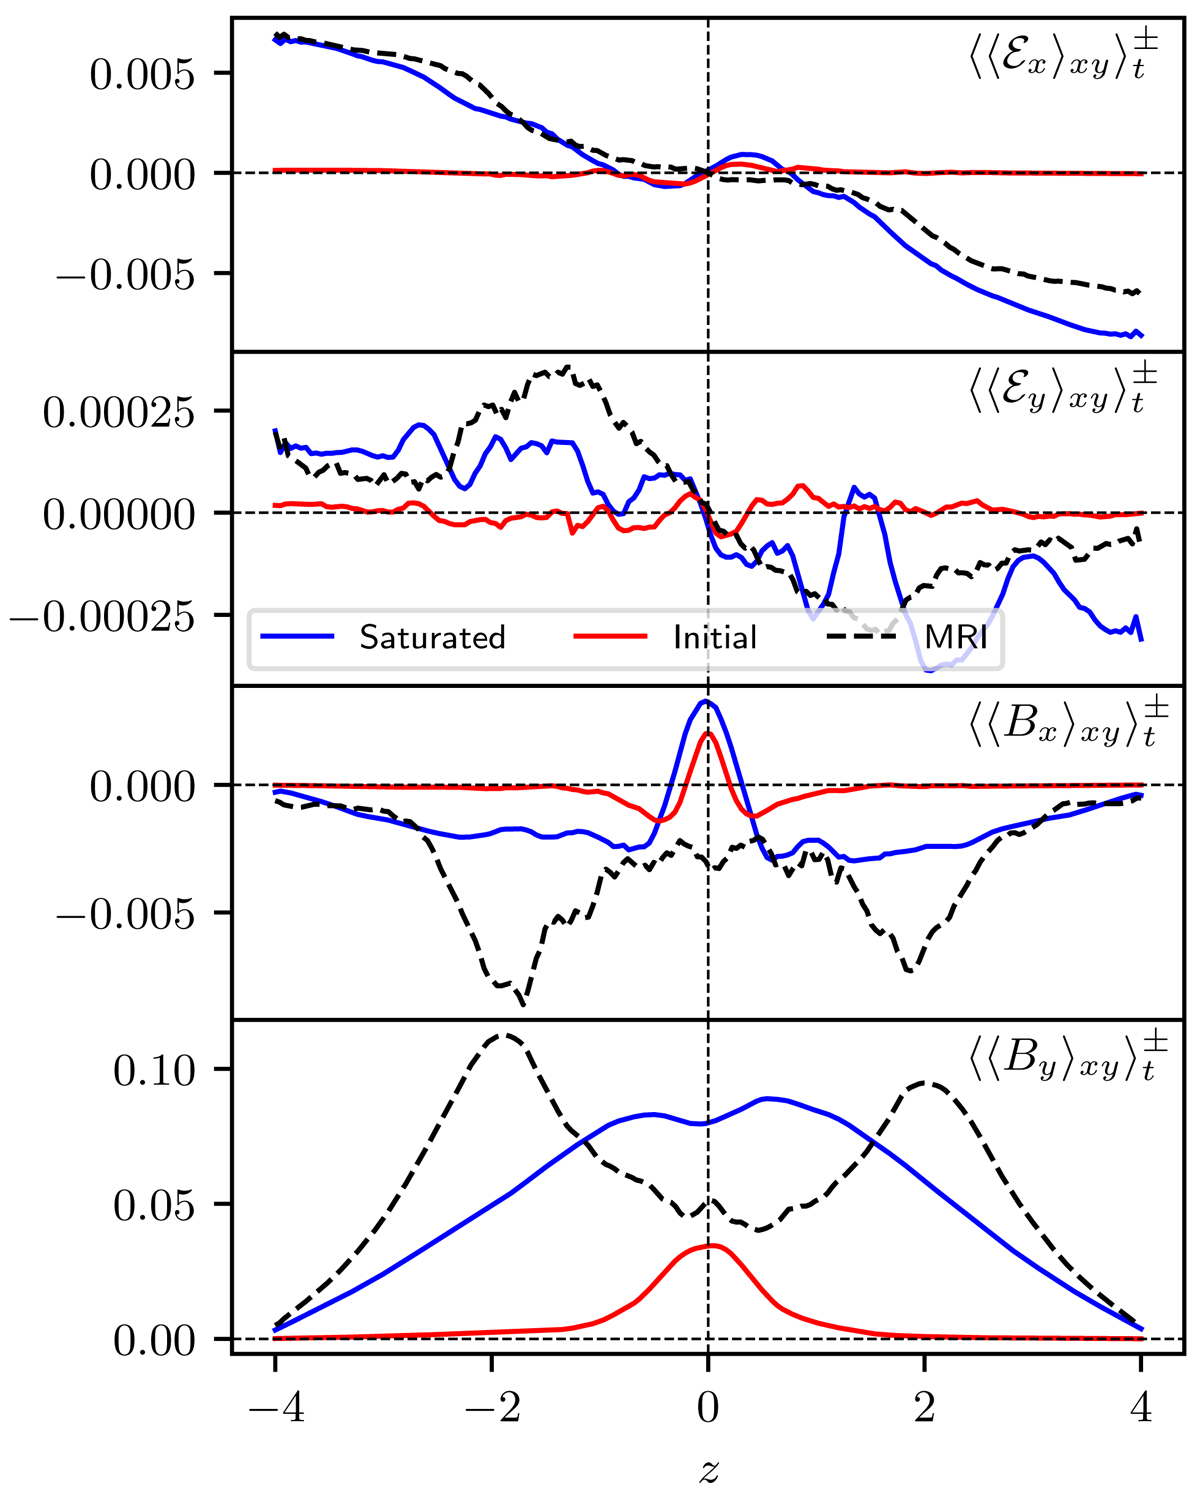
Horizontally averaged field components and EMFs as a function of z. Solid curves correspond to sg-mhd-tau20, and dashed curves correspond to MRI-compare. The first two images depict ℰx, and ℰy, respectively. Images three and four show the magnetic field components Bx and By, respectively. The red curves were averaged over the 200 − 400![]() interval of sg-mhd-tau20, and the blue profiles over the 800 − 1300
interval of sg-mhd-tau20, and the blue profiles over the 800 − 1300![]() interval. The time samples were evaluated every 2
interval. The time samples were evaluated every 2![]() . The dashed curves correspond to MRI-compare and were averaged over the 100 − 1000
. The dashed curves correspond to MRI-compare and were averaged over the 100 − 1000![]() interval, with time samples every 1
interval, with time samples every 1![]() . All components change signs, and some even oscillate over time. Hence, a special time-averaging technique,
. All components change signs, and some even oscillate over time. Hence, a special time-averaging technique, ![]() , was applied to all shown profiles, f(z). Thereby, each quantity is multiplied by the momentary sign of ⟨By⟩xy(z, t) before the time average is applied.
, was applied to all shown profiles, f(z). Thereby, each quantity is multiplied by the momentary sign of ⟨By⟩xy(z, t) before the time average is applied.
Current usage metrics show cumulative count of Article Views (full-text article views including HTML views, PDF and ePub downloads, according to the available data) and Abstracts Views on Vision4Press platform.
Data correspond to usage on the plateform after 2015. The current usage metrics is available 48-96 hours after online publication and is updated daily on week days.
Initial download of the metrics may take a while.