Open Access
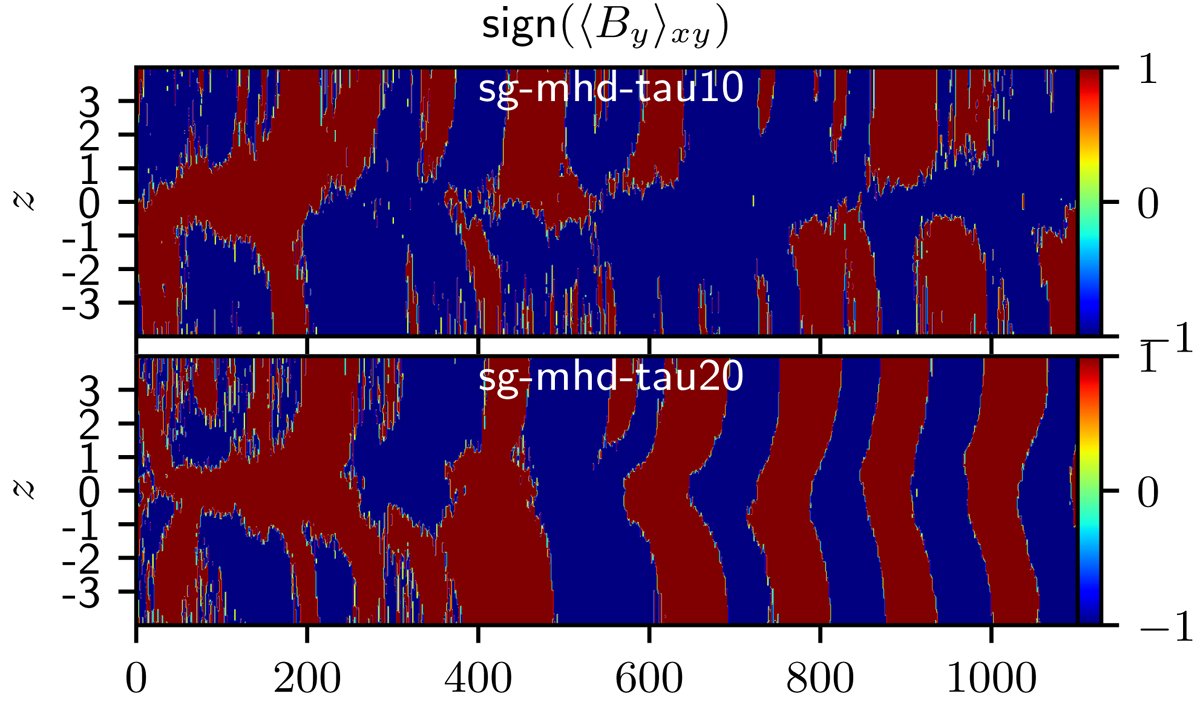
Fig. 4.
Download original image
Sign of the horizontally averaged toroidal magnetic field component. In this case, the “sign” has been intended to be a mathematical function, returning the sign of a value. sign(⟨By⟩xy), shown for simulations sg-mhd-tau10 and sg-mhd-tau20. The images can be directly compared to the corresponding zt diagrams in Fig. 3.
Current usage metrics show cumulative count of Article Views (full-text article views including HTML views, PDF and ePub downloads, according to the available data) and Abstracts Views on Vision4Press platform.
Data correspond to usage on the plateform after 2015. The current usage metrics is available 48-96 hours after online publication and is updated daily on week days.
Initial download of the metrics may take a while.