Fig. 20.
Download original image
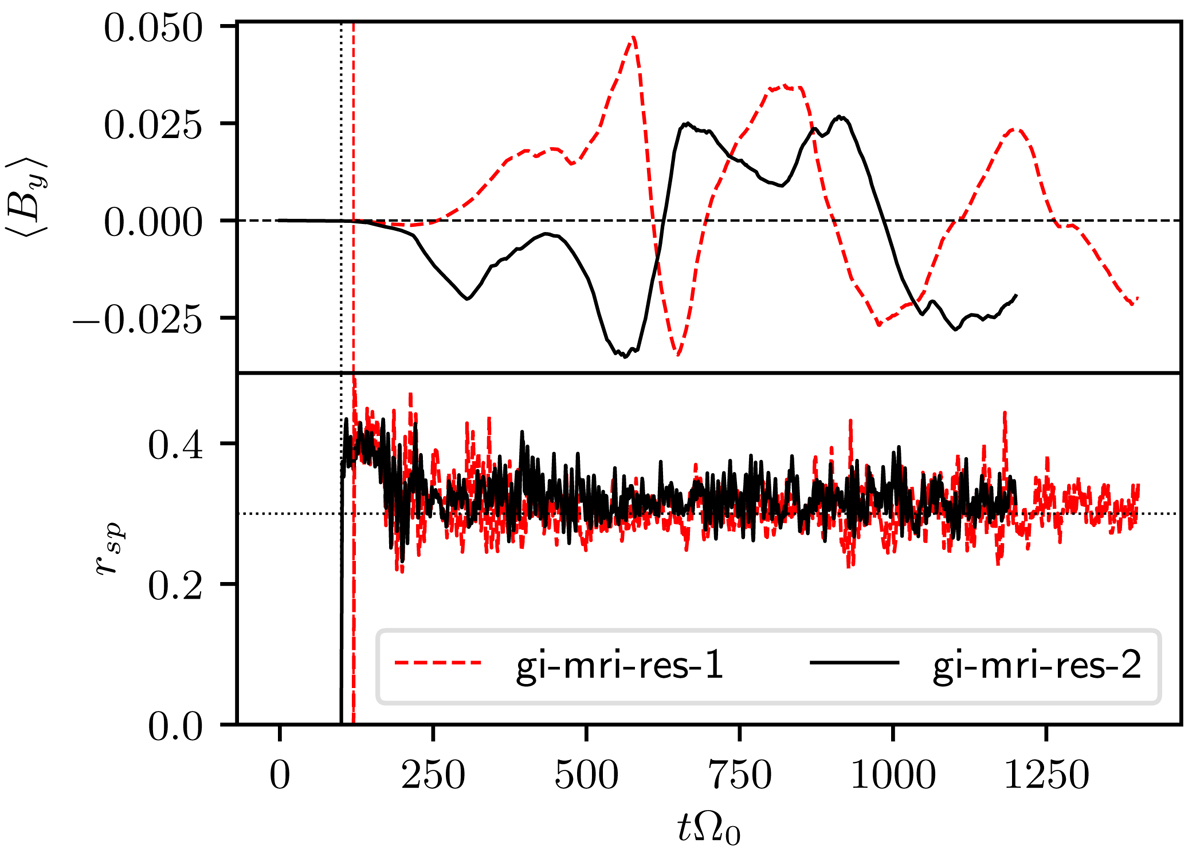
Time evolution for both the volume-averaged magnetic field component, ⟨By⟩ (first image) and the magnetic stress-to-pressure ratio, rsp = ⟨ − 2BxBy⟩/⟨|B|2⟩ (second image). Simulation gi-mri-res-1 is depicted as the dashed red curve, and gi-mri-res-2 is shown as the black curve. For reference, the value rsp = 0.3 is shown as the horizontal dashed line in the second image. The vertical, dashed, and dotted lines mark the time points when the seed fields are introduced.
Current usage metrics show cumulative count of Article Views (full-text article views including HTML views, PDF and ePub downloads, according to the available data) and Abstracts Views on Vision4Press platform.
Data correspond to usage on the plateform after 2015. The current usage metrics is available 48-96 hours after online publication and is updated daily on week days.
Initial download of the metrics may take a while.