Fig. 19.
Download original image
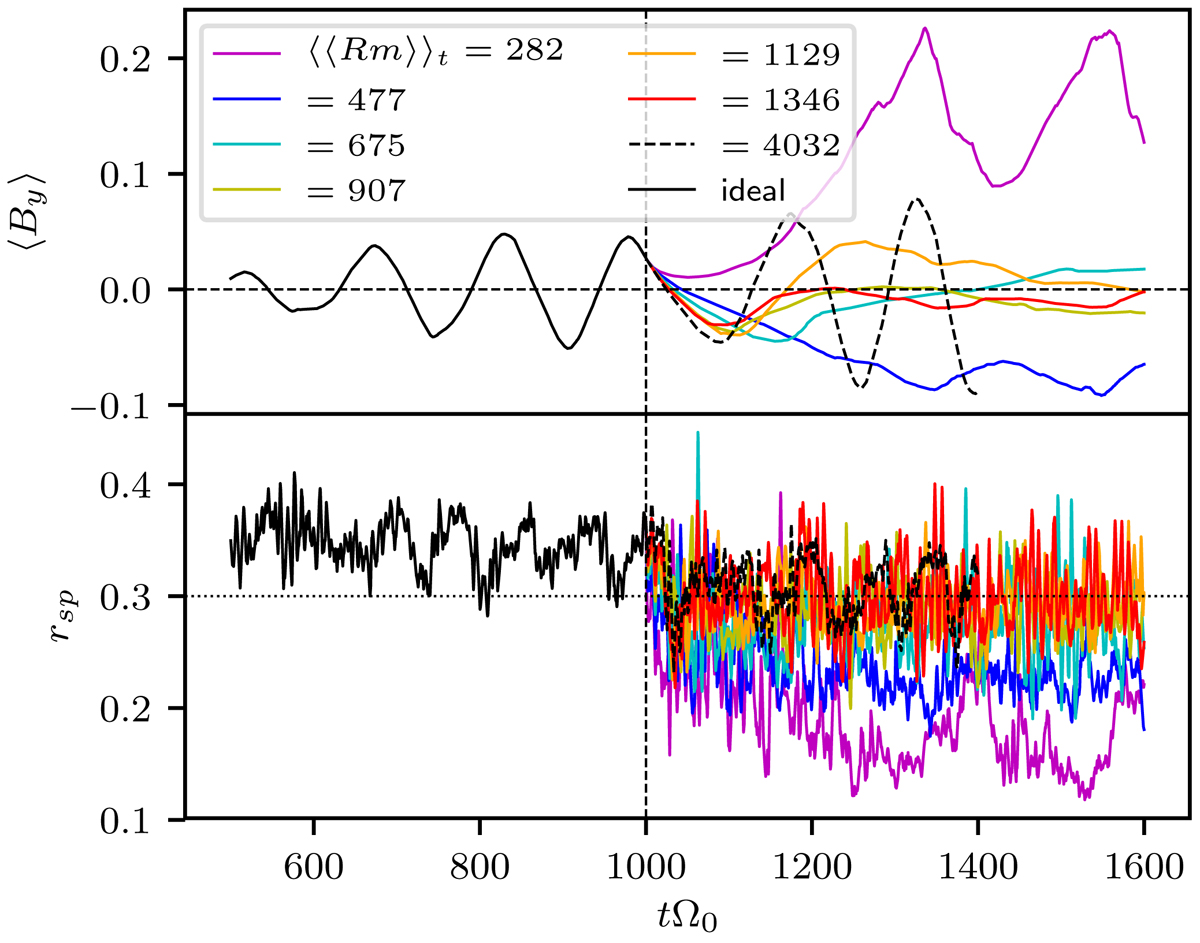
Time evolution of the volume-averaged magnetic field component (⟨By⟩; first image) and the magnetic stress to pressure ratio (rsp = ⟨ − 2BxBy⟩/⟨|B|2⟩, second image). The time axis starts at tΩ0 = 600 and extends towards tΩ0 = 1600. Simulation sg-eta01 was run until 2400![]() , but for comparison it is only plotted for tΩ0 ≤ 1600. The case sg-eta0006 was only run to 1400
, but for comparison it is only plotted for tΩ0 ≤ 1600. The case sg-eta0006 was only run to 1400![]() . The tΩ0 ≤ 1000 interval corresponds to the ideal-MHD case sg-mhd-2 (see Löhnert & Peeters 2022, or Table 1). All resistive simulations were restarted from sg-mhd-2 at 1000
. The tΩ0 ≤ 1000 interval corresponds to the ideal-MHD case sg-mhd-2 (see Löhnert & Peeters 2022, or Table 1). All resistive simulations were restarted from sg-mhd-2 at 1000![]() . The horizontal dashed line in the second image indicates rsp = 0.3.
. The horizontal dashed line in the second image indicates rsp = 0.3.
Current usage metrics show cumulative count of Article Views (full-text article views including HTML views, PDF and ePub downloads, according to the available data) and Abstracts Views on Vision4Press platform.
Data correspond to usage on the plateform after 2015. The current usage metrics is available 48-96 hours after online publication and is updated daily on week days.
Initial download of the metrics may take a while.