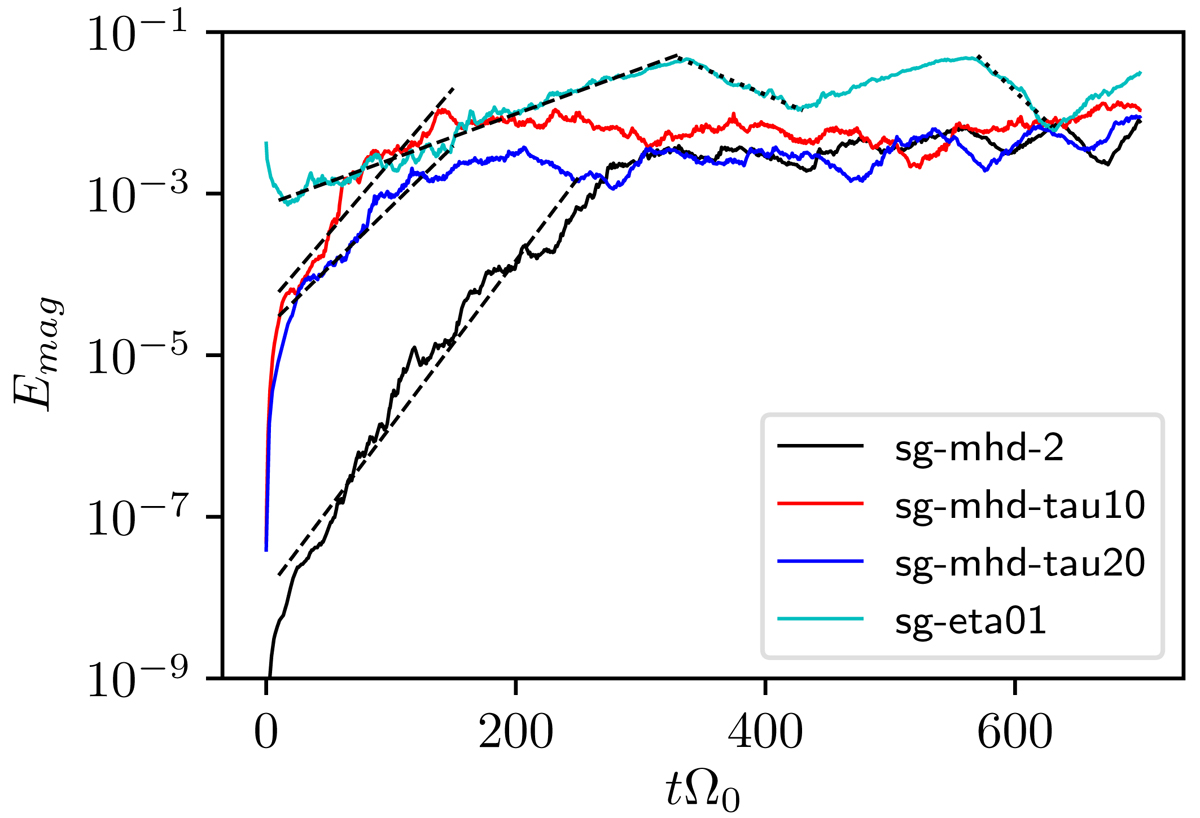
Fig. 18.
Download original image
Volume-averaged magnetic energy density, Emag, for the ideal-MHD simulations sg-mhd-2 (black), sg-mhd-tau10 (red), and sg-mhd-tau20 (blue) and the resistive simulation sg-eta01 (cyan). The time axis starts at t = 0 for all simulations. For the ideal-MHD runs, this corresponds to the moment of field seeding and for the resistive run, (t = 0) corresponds to the moment when resistivity was introduced. The dashed black lines correspond to linear fits, according to the values in Table 5.
Current usage metrics show cumulative count of Article Views (full-text article views including HTML views, PDF and ePub downloads, according to the available data) and Abstracts Views on Vision4Press platform.
Data correspond to usage on the plateform after 2015. The current usage metrics is available 48-96 hours after online publication and is updated daily on week days.
Initial download of the metrics may take a while.