Fig. 17.
Download original image
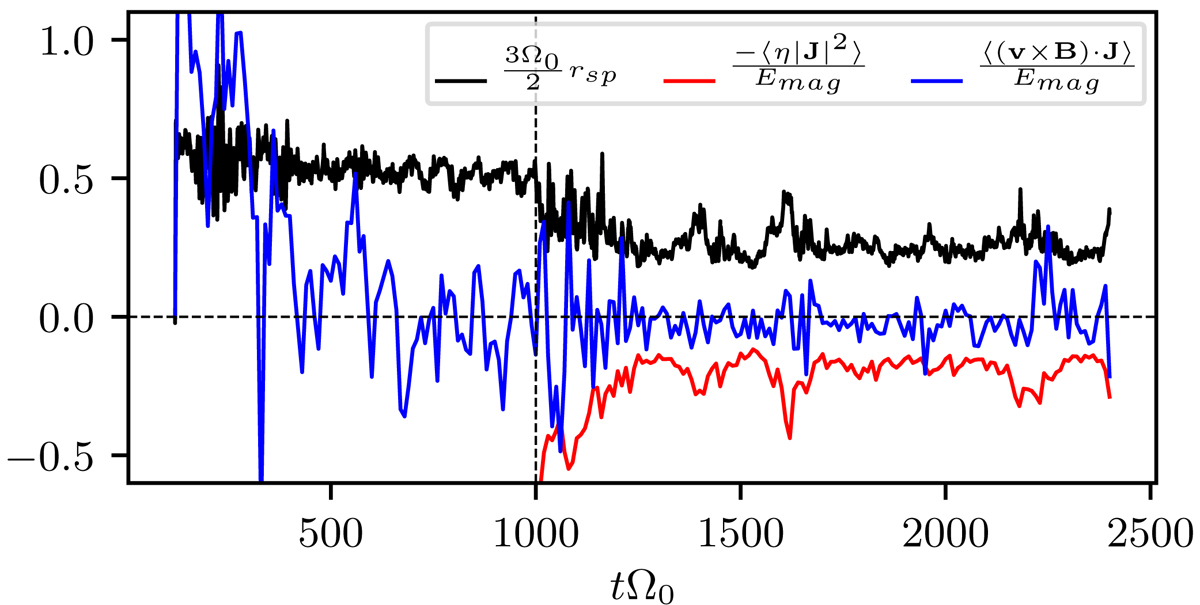
Contributions to the magnetic energy balance evaluated for sg-eta01 as a function of time. All values are normalised by the momentary magnetic energy density, Emag. Shown in blue is the volume-averaged rate at which magnetic energy is converted to kinetic energy, ⟨v × B ⋅ J⟩. The values were calculated from the full three-dimensional output data using central differences every 10![]() . The contribution arising from the Maxwell stress is shown as the black curve. Shown in red is the volumetric Ohmic dissipation rate, ⟨ − η|J|2⟩, also evaluated every 10
. The contribution arising from the Maxwell stress is shown as the black curve. Shown in red is the volumetric Ohmic dissipation rate, ⟨ − η|J|2⟩, also evaluated every 10![]() (see also Fig. 16). The time before tΩ0 = 1000 corresponds to the ideal simulation, sg-mhd-2 (see also Löhnert & Peeters 2022). The resistive phase of sg-eta01 starts at tΩ0 = 1000.
(see also Fig. 16). The time before tΩ0 = 1000 corresponds to the ideal simulation, sg-mhd-2 (see also Löhnert & Peeters 2022). The resistive phase of sg-eta01 starts at tΩ0 = 1000.
Current usage metrics show cumulative count of Article Views (full-text article views including HTML views, PDF and ePub downloads, according to the available data) and Abstracts Views on Vision4Press platform.
Data correspond to usage on the plateform after 2015. The current usage metrics is available 48-96 hours after online publication and is updated daily on week days.
Initial download of the metrics may take a while.