Fig. 16.
Download original image
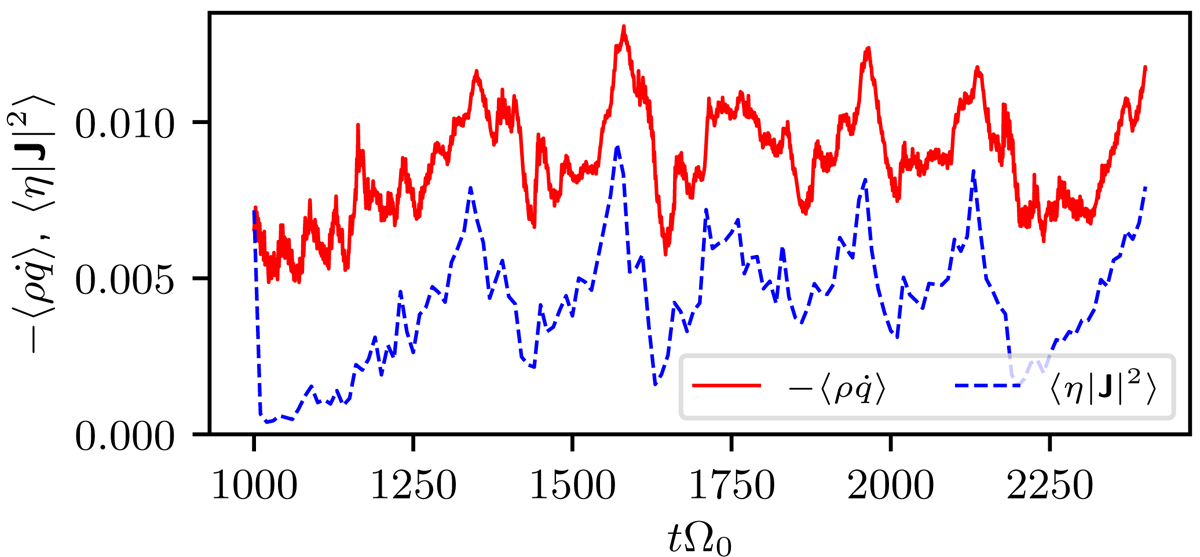
Negative cooling (heating) rate (![]() , solid red curve) and the resistive dissipation rate (⟨η|J|2⟩, dashed blue curve) evaluated for sg-eta01 as a function of time. Resistivity was enabled at tΩ0 = 1000. The values of ⟨η|J|2⟩ were calculated from the full three-dimensional output data using central differences for derivatives every 10
, solid red curve) and the resistive dissipation rate (⟨η|J|2⟩, dashed blue curve) evaluated for sg-eta01 as a function of time. Resistivity was enabled at tΩ0 = 1000. The values of ⟨η|J|2⟩ were calculated from the full three-dimensional output data using central differences for derivatives every 10![]() .
.
Current usage metrics show cumulative count of Article Views (full-text article views including HTML views, PDF and ePub downloads, according to the available data) and Abstracts Views on Vision4Press platform.
Data correspond to usage on the plateform after 2015. The current usage metrics is available 48-96 hours after online publication and is updated daily on week days.
Initial download of the metrics may take a while.