Fig. 15.
Download original image
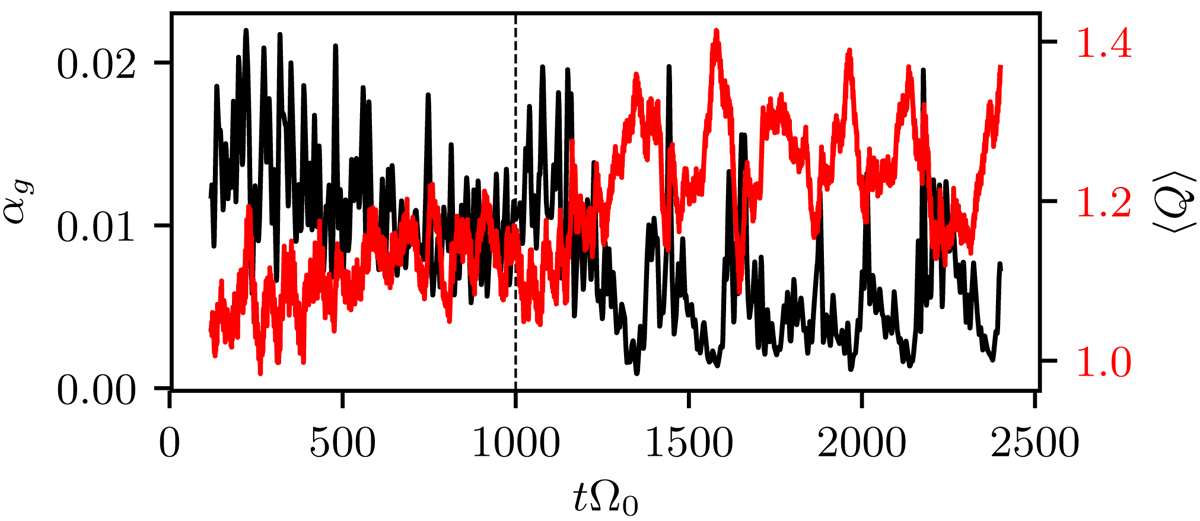
Time evolution of the volume-averaged Toomre parameter, ⟨Q⟩ (red curve), and the dimensionless gravitational stress, αg (black curve), evaluated for sg-eta01. The vertical dashed line at tΩ0 = 1000 marks the time point at which resistivity is introduced. The αg values were smoothed using a Gaussian function with standard deviation σ = 3![]() .
.
Current usage metrics show cumulative count of Article Views (full-text article views including HTML views, PDF and ePub downloads, according to the available data) and Abstracts Views on Vision4Press platform.
Data correspond to usage on the plateform after 2015. The current usage metrics is available 48-96 hours after online publication and is updated daily on week days.
Initial download of the metrics may take a while.