Fig. 12.
Download original image
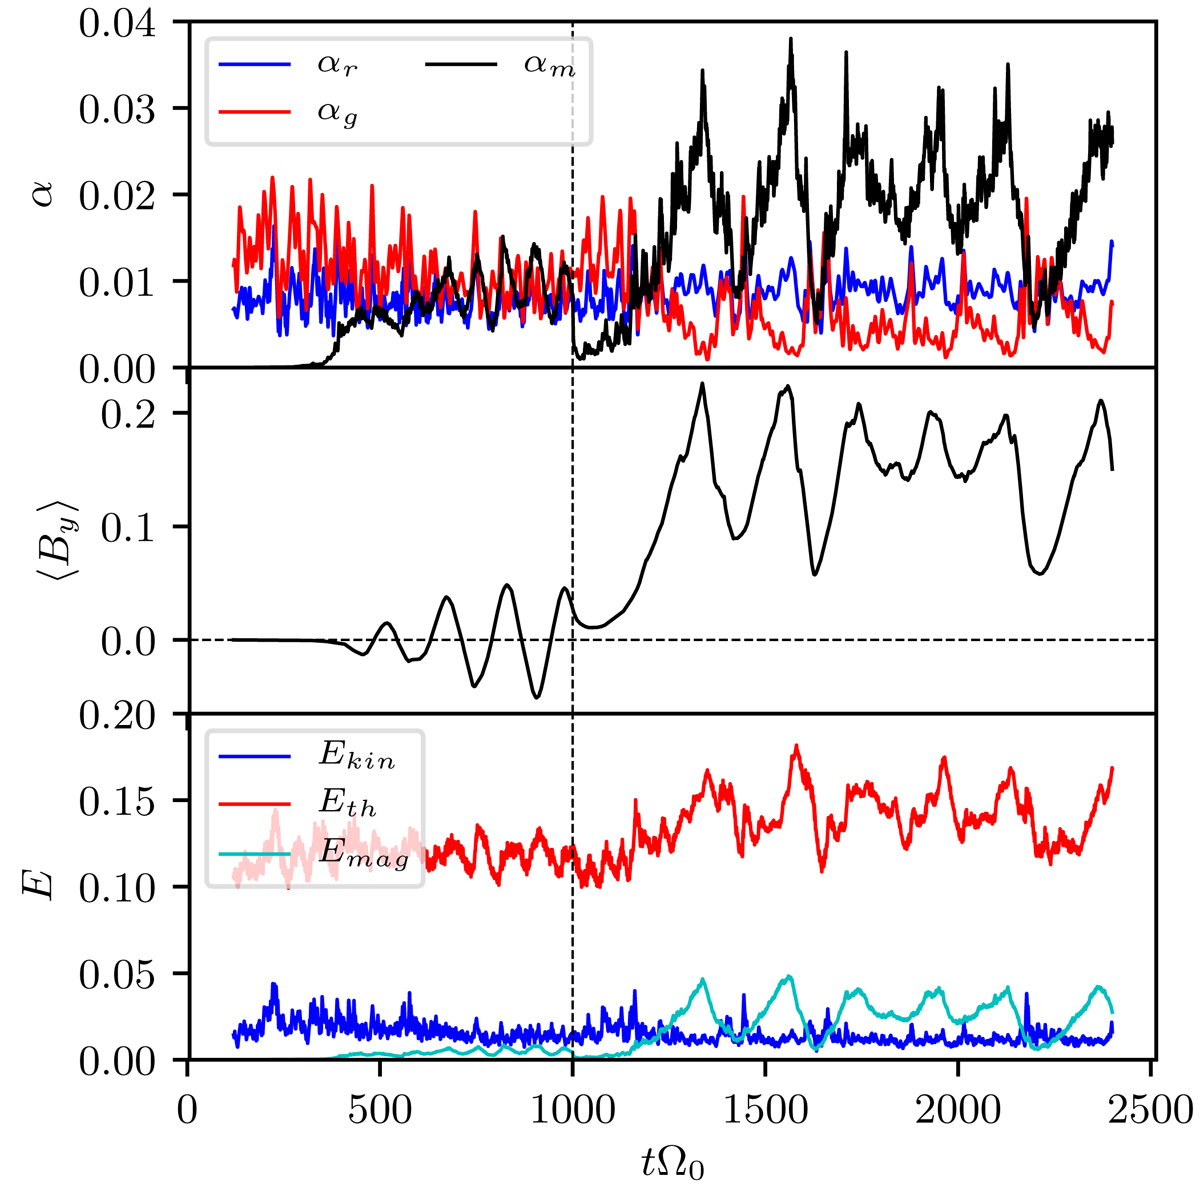
Time evolutions for a selection of volume-averaged quantities evaluated for sg-eta01. First image: Turbulent stresses αr (Reynolds), αm (Maxwell), and αg (gravitational) as a function of time. The values for both αg and αr were smoothed by convolving the respective time series with a Gaussian function and with a standard deviation of σ = 3![]() . Second image: Volume-averaged toroidal magnetic field component, ⟨By⟩. Third image: Volume-averaged energy densities Ekin (blue), Eth (red), and Emag (cyan). In all images, the vertical dashed line marks the time point when resistivity is enabled.
. Second image: Volume-averaged toroidal magnetic field component, ⟨By⟩. Third image: Volume-averaged energy densities Ekin (blue), Eth (red), and Emag (cyan). In all images, the vertical dashed line marks the time point when resistivity is enabled.
Current usage metrics show cumulative count of Article Views (full-text article views including HTML views, PDF and ePub downloads, according to the available data) and Abstracts Views on Vision4Press platform.
Data correspond to usage on the plateform after 2015. The current usage metrics is available 48-96 hours after online publication and is updated daily on week days.
Initial download of the metrics may take a while.