Fig. 11.
Download original image
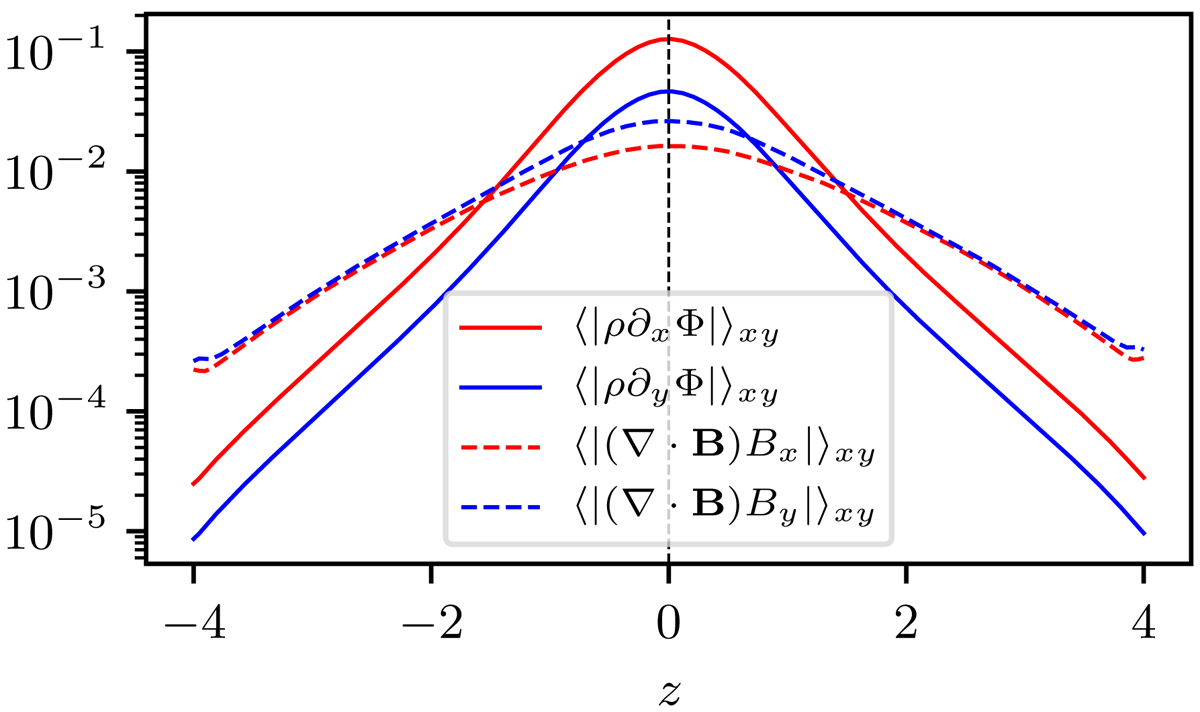
Absolute values of the field line bending forces, ⟨⟨|(B ⋅ ∇)Bx, y|⟩xy⟩t (solid curves), and the self-gravity forces, ⟨⟨|ρ∂x, yΦ|⟩xy⟩t (dashed curves), in directions x (red) and y (blue), evaluated for simulation sg-mhd-tau20. The time average is over the interval 800 ≤ tΩ0 ≤ 1300. The force densities were calculated using finite differences from the full three-dimensional output data of Athena every 10![]() . We note that μ0 = 1 in code units.
. We note that μ0 = 1 in code units.
Current usage metrics show cumulative count of Article Views (full-text article views including HTML views, PDF and ePub downloads, according to the available data) and Abstracts Views on Vision4Press platform.
Data correspond to usage on the plateform after 2015. The current usage metrics is available 48-96 hours after online publication and is updated daily on week days.
Initial download of the metrics may take a while.