Fig. 9.
Download original image
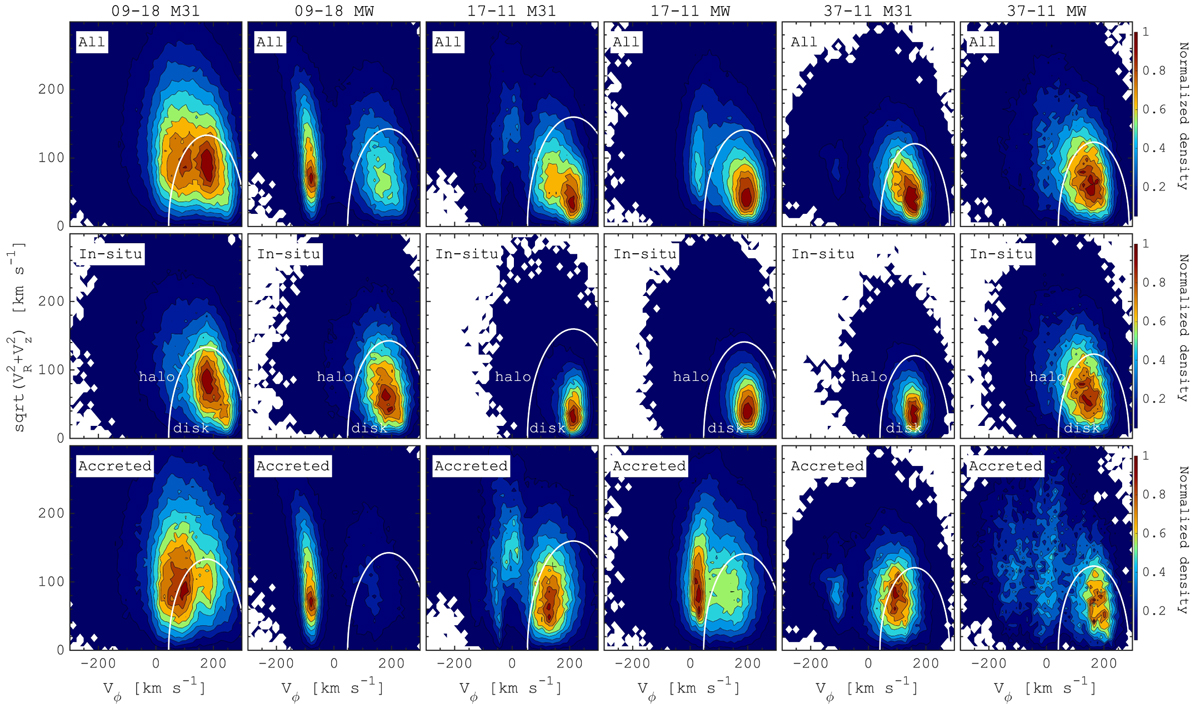
Toomre diagram for stars located in (1 − 3) Rd at z = 0 (Rd is the disc scale length from Libeskind et al. 2020). The top panels show all of the stars; middle panel corresponds to in situ populations only; and the bottom panel shows all accreted stars. In each panel, the distributions are normalised by the maximum value. White lines correspond to a threshold that is used to distinguish stars with disc-like kinematics from stars with halo-like kinematics (see, e.g. Nissen & Schuster 2010): ![]() , where 180 km s−1 is the value typically used in the MW, 240 km s−1 is the LSR in the MW (Reid et al. 2014) and VLSR is the mean rotational velocity in a flat part of the rotation curve in a given HESTIA galaxy at z = 0. Even taking some overlap into account, the distribution of accreted and in situ stars is very much so different, where in situ stars show mainly disc-like kinematics while the accreted stars show a diverse behaviour: from strongly counter-rotating (in MW 09−18) to non-rotating (M 31 and MW in 17−11) or weakly co-rotating (M 31 in 09−18), but also mixed kinematical properties (M 31 and MW in 37−11).
, where 180 km s−1 is the value typically used in the MW, 240 km s−1 is the LSR in the MW (Reid et al. 2014) and VLSR is the mean rotational velocity in a flat part of the rotation curve in a given HESTIA galaxy at z = 0. Even taking some overlap into account, the distribution of accreted and in situ stars is very much so different, where in situ stars show mainly disc-like kinematics while the accreted stars show a diverse behaviour: from strongly counter-rotating (in MW 09−18) to non-rotating (M 31 and MW in 17−11) or weakly co-rotating (M 31 in 09−18), but also mixed kinematical properties (M 31 and MW in 37−11).
Current usage metrics show cumulative count of Article Views (full-text article views including HTML views, PDF and ePub downloads, according to the available data) and Abstracts Views on Vision4Press platform.
Data correspond to usage on the plateform after 2015. The current usage metrics is available 48-96 hours after online publication and is updated daily on week days.
Initial download of the metrics may take a while.