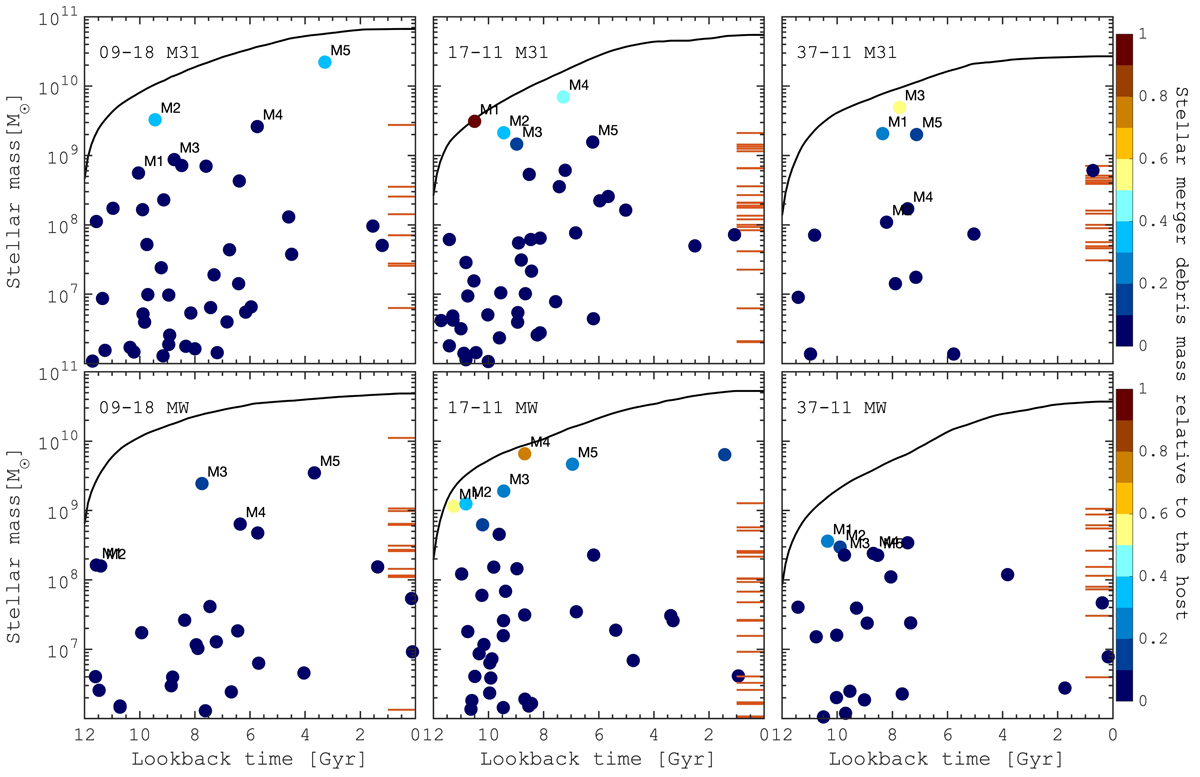
Fig. 4.
Download original image
Mergers history of the HESTIA galaxies. The in situ stellar mass growth for the six M 31 and MW HESTIA galaxies is shown by the black line. Mergers are shown by the coloured circles representing the time of accretion and the stellar mass of a satellite at that time. The circles are colour-coded by the stellar mass ratio relative to the host (μ*, colour bars are on the right). Red horizontal lines show the populations of dwarf galaxies that survive until z = 0. Five of the most significant mergers are marked as M1–M5 where the number increases from the earliest to the most recent ones. The HESTIA galaxies experienced between one to four massive merger events with the stellar mass ratio > 10% relative to the host in situ component, while the other mergers are less significant in terms of stellar mass. The number of merger events significantly decreases starting from ≈8 Gyr ago.
Current usage metrics show cumulative count of Article Views (full-text article views including HTML views, PDF and ePub downloads, according to the available data) and Abstracts Views on Vision4Press platform.
Data correspond to usage on the plateform after 2015. The current usage metrics is available 48-96 hours after online publication and is updated daily on week days.
Initial download of the metrics may take a while.