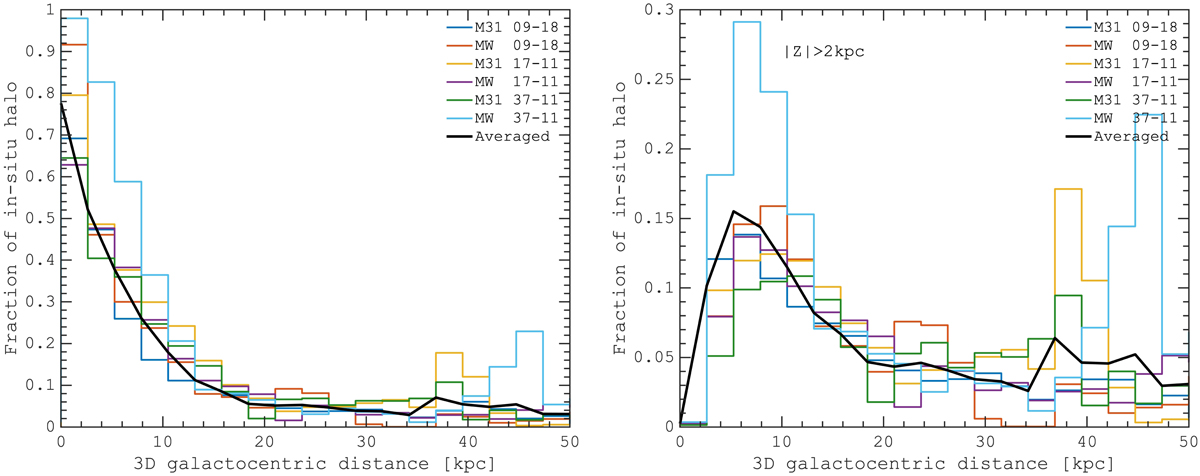
Fig. 12.
Download original image
Relative fraction of the in situ stellar halo as a function of the 3D galactocentric distance in different models at z = 0. The left panel shows the data without any spatial selections, while in the right panel we adopted |z|> 2 kpc selection. The in situ halo is defined above the white line in the Toomre diagram in Fig. 9. In all the HESTIA galaxies, similar to the results of the H3 survey of the MW halo (Naidu et al. 2020), the in situ halo contribution rapidly decreases beyond ≈10 kpc and does not exceed 2 − 5% at larger distances. We note that recent massive mergers in M 31 (09−18) and M 31 (17−11) galaxies (see Fig. 4) result in the overdensity of in situ populations at ≈45 kpc.
Current usage metrics show cumulative count of Article Views (full-text article views including HTML views, PDF and ePub downloads, according to the available data) and Abstracts Views on Vision4Press platform.
Data correspond to usage on the plateform after 2015. The current usage metrics is available 48-96 hours after online publication and is updated daily on week days.
Initial download of the metrics may take a while.